(The description in English is shown after the Japanese sentence.)
本ブログ内のDSMC計算では,Birdのオリジナルの方法(Bird法, B_original or B_origin)[文献 1),2),3)] と,宇佐美が改良しQ.Sunらの提案も加えた方法(Usys法 or U_system)[文献 4),5),6),7),8),9)] の,2つの方法が選べるようになっている.B_originに比べて,U_systemは計算時間が余計にかかるが,セルを細かくしたのと同等な効果が現れ,平均自由行程と同程度のセル長を採用するのが困難であるような比較的密度の高い状態での計算に有効である.ただし,現時点より前の流れ場状態を計算に利用するなど,その算法の性質上,理論的な裏づけに乏しい面があり,必ずしも,学会で広く認められている方法ではない.どちらの方法を使うかは,このブログを利用される皆さんの選択に任されます.もちろん,両方で計算を行い,自分自身で優劣を比較されるというのも良いでしょう.乱数を用いるというモンテカルロ法に特有のランダム性のために,乱流現象の再現が,DSMC法によって可能になるのではないかという期待を生む.これに関しては,今後に予定している「円管内流速度分布のDSMC計算」の中で示すようにしたい.なお,本ブログを見てDSMC法に興味を持たれた方が,将来,この計算法の更なる発展に貢献されるとしたら,私にとってこの上なく喜ばしいことである.
単純な超音速自由噴流の計算
上流と下流の間の圧力比を50に固定した上で,上流圧力を任意に指定し,円形孔からアルゴン単一気体が噴出して生じる「超音速噴流」の密度,速度,温度の分布形状をDSMC法で再現する.これは,軸対称を仮定した計算である.今回は,試し計算であるから,非常に粗い空間分割セルを用いたDSMC計算となっている.また,本ブログにおける最初のDSMC計算なので,取扱い方法を間違わないようにするため,上流圧力以外の計算条件は固定して変更できなくしてある.
(ご注意)
ダウンロードしたソフトウェアの実行によって,もし,お使いのPCに障害が生じたり,また何らかの損害が生じたり,あるいは第三者との訴訟等が生じたとしても,当ブログ管理者は一切の責任を負いません.もしこのことに同意できない場合は,ただちにダウンロードを中止してください.ダウンロードされた場合は,このことに同意されたものと見なします.
(もう少し長いコメント)
本ソフトウェアによる計算実行に際し,トラブルを最小限に止めるために,次のような方法をお勧めします.もちろん,この方法を絶対に行わなければならないというものではありません.念のための予防です.
(1)計算の実行中は,PCをインターネットに繋がない(できれば,結線を外す).
(2)計算の途中で,ネットに繋ぎたいことが生じたときには,計算を途中で中断しても構いません.計算実行中,中途状態のデータを時々記録しているので,あとから,そのデータを使って計算を再開できます.このことは,長時間に亘る(あるいは何日にも亘る)ような計算についても同様に言えて,PCを途中で休ませることができます.
(3)計算を終了したら,まず最初に,信頼できるセキュリティソフトを使って,セキュリティのチェックを行い,PCに問題がないかどうか確認してください.セキュリティチェックは,ネットに繋がないで行った方がよいですが,ネットに繋がないとチェックできない場合はその限りではありません.
1.圧縮ファイル FILE001e をダウンロードし,それを解凍して3つのファイルにする.具体的には,PCのDownloadsフォルダ内に,ダウンロードされた FILE001e.zip が作られるので,それをそのまま,あらかじめインストールしておいたデスクトップ上の解凍ツール のアイコンに ドラッグ・アンド・ドロップ する.これにより,デスクトップ上に FILE001e フォルダが出来上がり,その中に,3つのファイルが作成されている.この中で,計算実行してもよいが,一般的には,任意の名前の新たなフォルダを作り,その中に3つのファイルを入れて実行する.
2.ファイル JET-P3S2.EXE(あるいは単に JET-P3S2) をダブルクリックすると,コマンドプロンプト(黒色のWindow)が開き,その中で計算が開始される.計算実行しようとした際,もし,Microsoft Defender SmartScreen が「SmartScreenを使用できません」と言ってきても,SmartScreenは賢くないので,気にせず,「実行」してください.
3.恐らく,そのコマンドプロンプトは横幅が狭いので,コマンドプロンプトの上部を右クリックしてプロパティを開き,レイアウトの中のウインドウサイズの幅を140~150くらいに広げるとよい.
4.計算開始時の入力は以下の6つ.
(1) 上流の圧力を Torr(mmHgと同じ)の単位で入力する.例えば,760(大気圧)を入力する.この値を小さくしていくと,噴流の構造変化が緩やかになっていくのが観測できる.とくに密度について比較すると分かり易い.なお,760 Torr を超える値を入力した場合は,760 Torr に制限される.
(2) Bird_originalで計算する場合は1を入力,あるいは,U_systemで計算する場合は0を入力する.
(3) 次に,「 ……. O.K. ? 」と表示されたら,通常は単に Enterキー を押す.
もし,計算途中に表示される行の数を 1/10 程度に少なくしたいなら,C あるいは c を入力する.表示行を少なくすると計算時間が多少節約される.
(4) 計算実行(Simulation) か,データ処理(Data Processing) か,を質問されるので,計算実行の場合は0,データ処理の場合は1を入力する.なお,計算実行が正常に終了したら,自動的に,データ処理の操作に移る.
(5) 使用しているPCのthread数が表示されるので,計算に使うthread数を,1から表示された(最大)thread数の間の数値を選んで入力する(通常,最大数を入れる).範囲外の数が入力されたときは,最大数が用いられる.なお,複数のCPUチップを持つPCの場合,本ブログでは,異なるCPUチップの core や thread を結びつけて並列計算することはできない.また,Windows の制約により 64 core あるいは 64 thread を超える並列計算もできない.
(6) 最初から計算開始する(From the Start) か,これまで行った計算の途中からの継続(Continuation) か,を質問されるので,最初からなら0を,継続計算なら1を入力する.
(7) 計算が終了すると,’= Calculation Time (sec)’ してと計算時間が秒で示されるので,それを確認して Enter キーを押すと,結果を処理するための手順に移る.なお,月をまたいで時間計測した場合は,正しい時間が表示されないことがある.
5.計算中の操作
(1) 計算実行にともなって,多くの数値が画面上を流れていく.その意味を知るためには,Fortranソースコードを解読するのがよいが,今回はそれについては省略する.ただ一つ,左から2番目に表示される数値に着目すると,数値が1づつ増加していくのが分かる(表示行数を1/10にした場合は10づつ).これは,DSMC計算において,「分子移動」と「分子間衝突」を分離している「微小時間」が,計算開始から何回カウントされたのかを示すものであり,今回の計算では,この数値 1000回ごとに途中の中間データを保存して継続計算の場合に備え,そして 20000回に達したら計算終了となる.
(2) 途中で計算を中断させたい場合には,表示されているコマンドプロンプト(黒色のWindow)を,計算中であっても削除すればよい.
6.結果の処理
結果処理時の入力は,以下の3つである.
(1) 出力データを,gnuplot用にするなら0を,tecplot用なら1を入力する.
出力ファイル名は,それぞれ,Ognu020 あるいは Otec020 となる.
(2) 表示結果を「次元つきデータ」にするなら0を,「上流値を1とした無次元データ」にするなら1を入力する(通常は 1).なお,流速については,上流温度における分子の最大確率速度で無次元化される.
(3) 結果表示の x軸方向の最大打切り値をいくらにするかを入力する(下流境界付近のデータは歪む可能性があるため).通常,10(オリフィス直径の10倍)くらいでよいが,歪みがどの程度であるかを知りたいのなら,15 を入力する.なお,後述する gnuplot でも打切り値を指定できる.
(4) 処理終了後は,上流圧力の値を示して一旦停止するが,Enter キーを押すと,コマンドプロンプト(黒色のWindow)は消える.
7.gnuplotにおけるデータ表示の方法
gnuplotの使い方については,インターネットで数多くの解説を見つけることができるので,詳細はそれに譲るが,ここでは,今回の結果表示の一つの具体例を示しておく.なお,tecplotの使い方については,そのソフトウェアに添付されている使用説明書を読んでください.下記において,日本では \ の記号は使えず,代わりに¥の記号を用いる.
(1) まず,gnuplot_5.4 を立ち上げる.
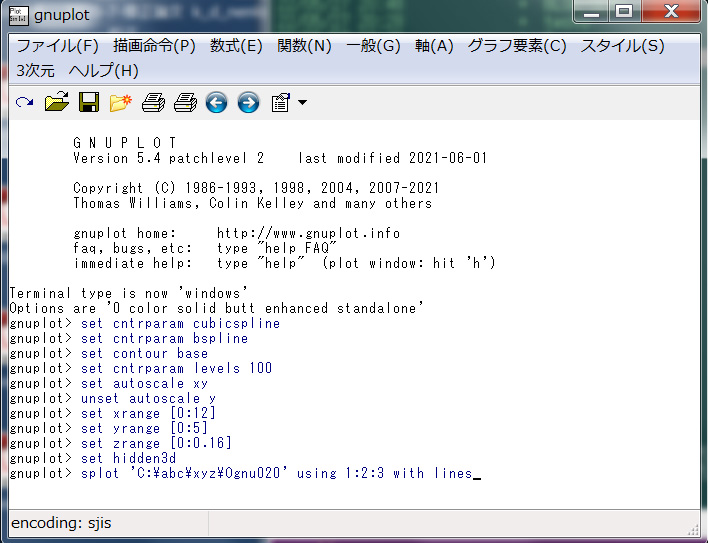
(2) gnuplot の Window の中に,次のような 11行の文を書き込む.ただし.最後の行の C:\.…. には,データ Ognu020 が入っているフォルダ名を書く.例えば,Cドライブ内の フォルダ abc の中の フォルダ xyz に,ファイル Ognu020 が入っているなら,’C:\abc\xyz\Ognu020′ となる.
set cntrparam cubicspline
set cntrparam bspline
set contour base
set cntrparam levels 100
set autoscale xy
unset autoscale y
set xrange [0:12]
set yrange [0:5]
set zrange [0:0.16]
set hidden3d
splot ‘C:\.….\Ognu020’ using 1:2:3 with lines
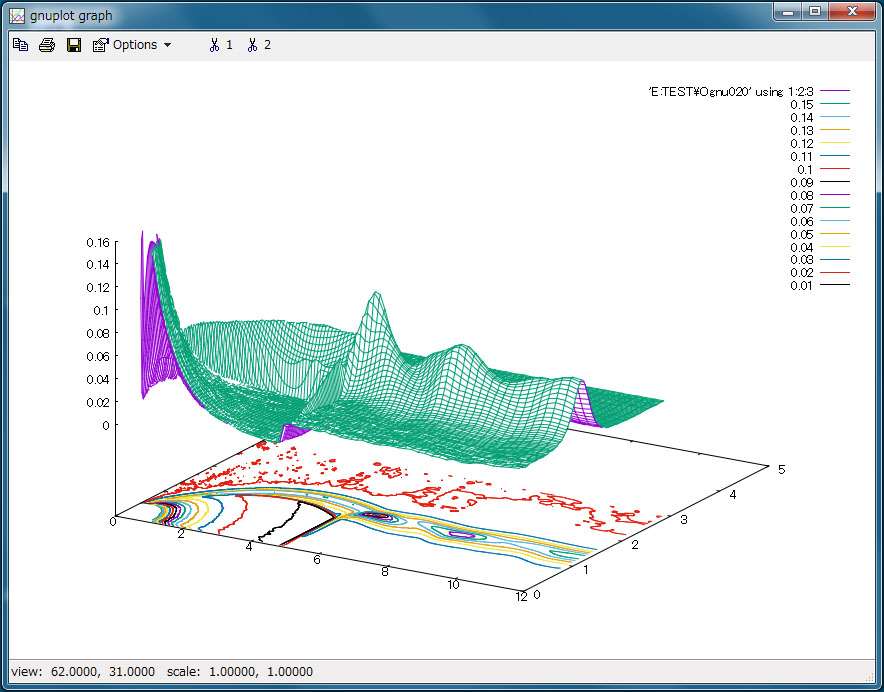
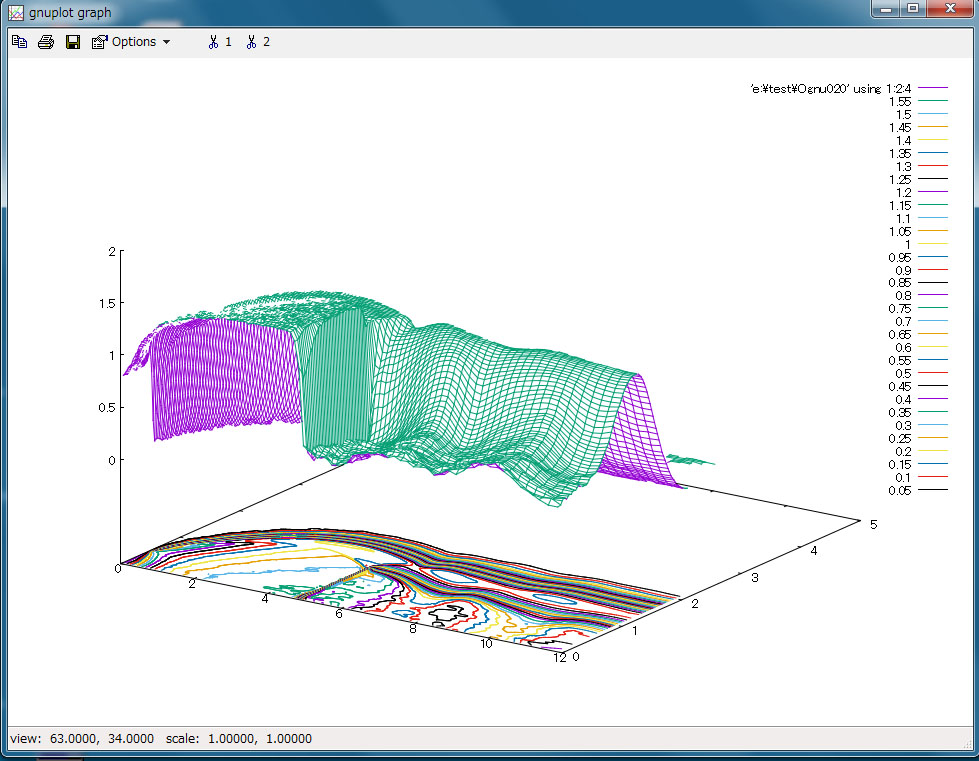
これにより,gnuplot graph の Window が開かれ,密度分布が表示される.次に,下記の2行を書き込むと,x方向の流速分布 u が表示される.
set zrange [0:2]
splot ‘C:\.….\Ognu020’ using 1:2:4 with lines
また,下記の2行を書き込むと,y方向の流速分布 v が表示される.
set zrange [-0.5:1.5]
splot ‘C:\.….\Ognu020’ using 1:2:5 with lines
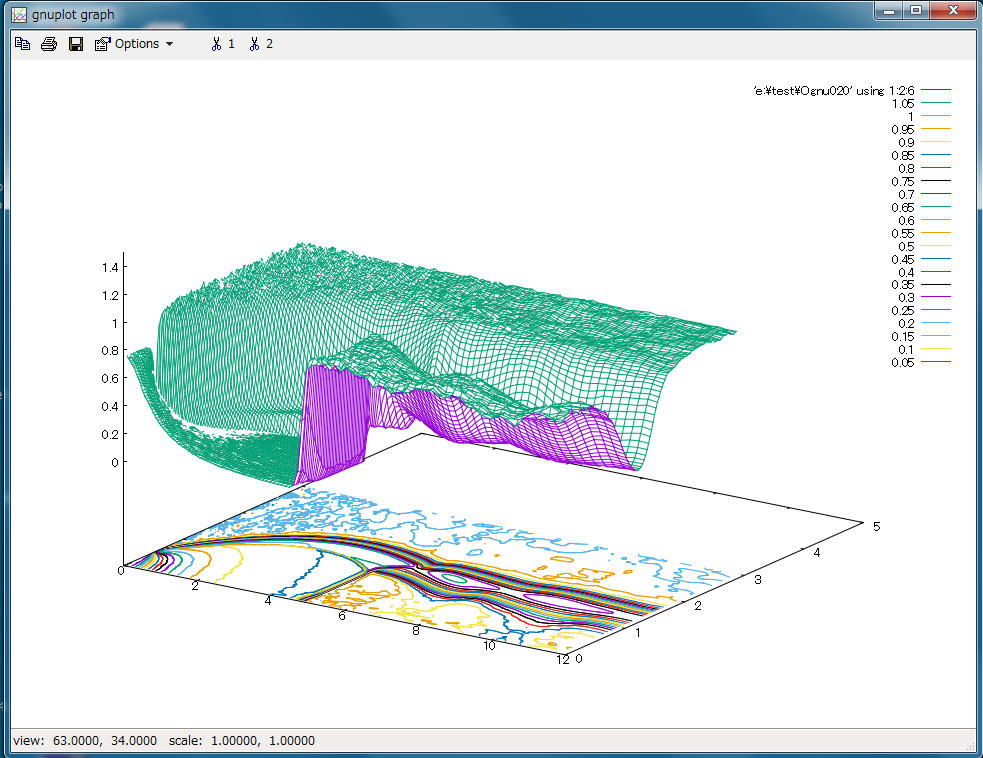
さらに,下記の2行を書き込むと,温度分布が表示される.
set zrange [0:1.5]
splot ‘C:\.….\Ognu020’ using 1:2:6 with lines
表示された各グラフは,マウスカーソルをgnuplot graph の中に置いた上で,マウスや矢印キーを用いて回転させることができる.ただし,このソフトウェアの反応は非常に遅いのでグラフ移動や回転の操作はゆっくり行うことが必要です.なお,上記各行の命令については,gnuplot の「ヘルプ」を参照して調べてください.
(結果のgnuplotグラフ)上流圧力は 760 Torr,U_system で計算
(a)密度分布
(b)x方向流速分布
(c)温度分布
8.複数のPCでの JET-P3S1 の計算時間比較(上流圧力は 760 Torr,U_system で計算,各CPUの最大thread数を使用)
今回は小規模な計算なので,この傾向が必ずしも大規模計算にも当てはまるとは限らない.計算途中に出力する行数により,100 sec 程度の差が出る.記録媒体が,HDDなのかSSDなのか,あるいは,M.2のSSDなのか,さらには,その種類(SATA, NVMe)や発売世代の違いにより,継続計算のために記録する大量中間データの書込み速度が大きく異なるので,それによっても終了時間に違いが生じる.もしあなたの使っているPCの計算速度が,下記の例に比べて著しく遅い場合,BIOS あるいは msconfig によって利用できるthread数に制限が加えられている可能性があるので,その制限を解除する必要があります.
(1)タブレットPC (Win10) CPU:Celeron-N4120 (4 cores) 4348 sec
(2)14インチノートPC (Win7) CPU:i7-3517U (4 threads) 4389 sec
(3)13インチノートPC (Win7) CPU:i7-4510U (4 threads) 4445 sec
(4)17インチノートPC (Win7) CPU:i7-2860QM (8 threads) 2633 sec
(5)14インチノートPC (Win11) CPU:i5-1235U (12 threads) 1656 sec (このPCを持つ知人に計算時間の測定を依頼)
(6)16インチノートPC (Win11) CPU: AMD-6800H (16 threads) 791 sec
(7)デスクトップPC (Win7) CPU:Xeon E3-1280 V2 (8 threads) 1604 sec
(8)デスクトップPC (Win10) CPU: Xeon E5-2699 V3 (36 threads) 693 sec
(9)デスクトップPC (Win10) CPU:AMD-2990wx (64 threads) 500 sec
(10)デスクトップPC (Win10) CPU:AMD-3970x (64 threads) 366 sec
(11)デスクトップPC (Win10) CPU:AMD-3990x (64 cores) 302 sec
(64 threads,もう一方のグループの64threadsが働いていない場合) 374 sec
(64 threads,もう一方のグループの64threadsが別のジョブを実行している場合) 404 sec
(128 threads) Windowsの制約で大幅なプログラム書換が必要なため未実行
(English)
In the DSMC calculation in this blog, two methods can be selected: Bird’s original method (Bird method, B_original or B_origin) [Reference 1),2),3)] and Usami’s improved method (Usys method or U_system) including Q.Sun et al.’s proposal [Reference 4),5),6),7),8),9)]. Compared to B_origin, U_system takes more calculation time, but it has the same effect as making the cell finer, and it is effective for calculation in relatively high density condition where it is difficult to adopt a cell length comparable to the mean free path. However, due to the nature of the algorithm, such as using the flow field state before the present time for calculation, there is a lack of theoretical support, and it is not necessarily a method widely accepted by academic societies. Which method you use is up to you. Of course, it is also good to calculate both and compare the superiority and inferiority by yourself. Due to the unique randomness of the Monte Carlo method, which uses random numbers, it is expected that the DSMC method will enable the reproduction of turbulence phenomena. This will be shown in the calculation “DSMC calculation of flow velocity distribution in a circular tube“. It would be my great pleasure if those who were interested in the DSMC method after seeing this blog would contribute to the further development of this calculation method in the future.
Simple calculation of supersonic free jet
After fixing the pressure ratio between upstream and downstream to 50, specify the upstream pressure arbitrarily, and the density, velocity, and temperature profiles of the supersonic jet generated by a single argon gas blowing out from a circular orifice are reproduced by the DSMC method. Axisymmetric is assumed. This time, because of a trial calculation, a very coarse network of spatial cells is used. This is the first DSMC calculation in this blog, so the calculation conditions other than the upstream pressure are fixed and cannot be changed in order not to make a mistake in the operation.
(please note)
This blog administrator is not responsible for any troubles, damages, or proceedings with a third party caused by the execution of the downloaded software. If you disagree with this, please stop the download immediately. If downloaded, it is considered that you have agreed to this.
(A little longer comment)
We recommend the following method to minimize troubles when executing calculations with this software. Of course, you don’t have to do this. It is a precaution just in case.
(1) While the calculation is being executed, the PC would be better off not being connected to the Internet (preferably unplug the network cable).
(2) If something you want to connect to the net occurs during the calculation, you may interrupt the calculation. Since the data in the middle state is recorded occasionally during the calculation execution, the calculation can be restarted later using the data. The same is true for calculations that last for long hours (or days), allowing the PC to rest prematurely.
(3) After completing the calculation, first check the security using reliable security software and check if there is a problem with your PC. It is better to perform the security check without connecting to the internet, but this is not the case if you cannot check without connecting to the internet.
1. Download the compressed file FILE001e and decompress it into three files. Specifically, the downloaded FILE001e.zip will be created in the Downloads folder of your PC, so drag and drop it as it is to the icon of the decompression tool on the desktop installed in advance. As a result, the FILE001e folder is created on the desktop, and three files are created in it. You may execute the calculation in the folder, but in general, make a new folder with an arbitrary name and put three files in it where the simulation is executed.
2. Double-clicking the file JET-P3S2.EXE (or just JET-P3S2) opens a command prompt (black window) in which the calculation starts. When you try to run it, if Microsoft Defender SmartScreen says “SmartScreen cannot be used,” don’t worry about it and just “Run” because SmartScreen is not smart.
3. Perhaps the command prompt is narrow, so right-click at the top of the command prompt to open Properties and widen the window size in the layout to around 140-150.
4. The following 6 inputs are required at the start of calculation.
(1) Enter the upstream pressure in units of Torr (same as mmHg). For example, enter 760 (atmospheric pressure). As this value is reduced, the structural change of the jet observed becomes weak. It is especially easy to understand when comparing the densities. If you enter a value that exceeds 760 Torr, you will be limited to 760 Torr.
(2) Enter 1 when calculating with Bird_original, or enter 0 when calculating with U_system.
(3) Next, when the message “… OK?” is displayed, usually simply press the Enter key.
If you want to reduce the number of lines displayed during the calculation to about 1/10, enter C or c. Reducing the number of display lines saves some calculation time.
(4) You will be asked whether to execute the calculation (Simulation) or data processing (Data Processing). Enter 0 for the execution of calculation or 1 for the data processing. If the calculation is completed normally, the data processing operation follows automatically.
(5) Since the number of threads of your PC is displayed, enter the number of threads used for calculation by selecting a value between 1 and the displayed (maximum) number of threads (usually, enter the maximum number). If a number outside the range is entered, the maximum number is used. In the case of a PC with multiple CPU chips, in this blog, it is not possible to connect cores and threads of different CPU chips for parallel calculation. Also, due to the restrictions of Windows, parallel calculation exceeding 64 cores or 64 threads is not possible.
(6) You will be asked whether to start the calculation from the beginning (From the Start) or to continue the calculation from the middle of the calculation (Continuation). Enter 0 for the continuation calculation or 1 for the continuation calculation.
(7) When the calculation is completed, the calculation time is shown in seconds as’= Calculation Time (sec)’. Check it and press the Enter key to move to the procedure for processing the result. If the calculation time measured over different months, the correct time may not be displayed.
5. Operation during calculation
(1) Many numerical values appear continuously on the screen as the calculation is executed. In order to know its meaning, it is better to decipher the Fortran source code, but this time we will omit it. If you focus on the number displayed second from the left, you can see that the number increases by 1 (10 when the number of displayed lines is 1/10). This shows how many times the “discrete time step” that separates “molecular motion” and “intermolecular collision” has been counted from the start of the calculation. The intermediate time data of the simulation is saved every 1000 times to allow calculations from the middle, and when this reaches 20000, the calculation ends.
(2) If you want to interrupt the calculation in the middle, you can delete the displayed command prompt (black window) even during the calculation.
6. Result processing
The following three inputs are used during result processing.
(1) Enter 0 for gnuplot or 1 for tecplot as the output data.
The output file names will be Ognu020 or Otec020, respectively.
(2) Enter 0 to set the display result to “data with dimensions”, or enter 1 to set the display result to “non-dimensional data with the upstream value as 1”. Enter 1 usually. The flow velocity is normalized by the most probable molecular thermal speed at the upstream temperature.
(3) Enter the maximum cutoff value in the x-axis (flow direction) of displaying the result. The maximum cutoff value is required because the data near the downstream boundary may be distorted. Normally, about 10 (10 times the orifice diameter) is sufficient, but if you want to know how much the distortion is, enter 15. You can also specify the cutoff value with gnuplot, which will be described later.
(4) After the processing is completed, the value of the upstream pressure is shown for confirmation and the operation is temporarily stopped. When the Enter key is pressed, the command prompt (black window) disappears.
7. How to display the flow field in gnuplot
As for how to use gnuplot, many explanations can be found on the Internet, so I will leave the details to them, but here I will show one concrete example of the result display. For how to use tecplot, please read the instruction manual attached to the software. In the following, the \ symbol cannot be used in Japan, and the ¥ symbol is used instead.
(1) First, launch gnuplot_5.4.
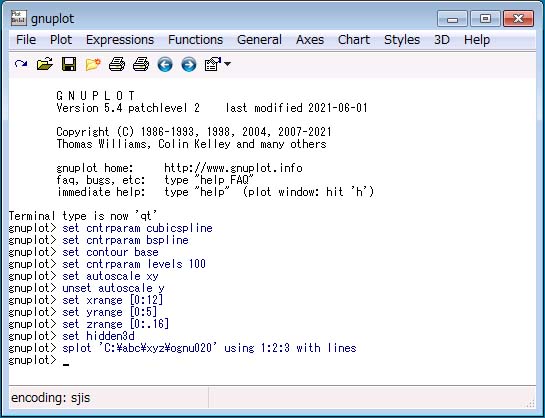
(2) Write the following 11-lines statement in the gnuplot Window. The expression “C:.….” appearing in the 11th line represents the name of the folder containing the file “Ognu020”. For example, if the file “Ognu020” is in the folder “xyz” in the folder “abc” in the C drive, it will be “C:\abc\xyz\Ognu020”.
set cntrparam cubicspline
set cntrparam bspline
set contour base
set cntrparam levels 100
set autoscale xy
unset autoscale y
set xrange [0:12]
set yrange [0:5]
set zrange [0:0.16]
set hidden3d
splot’C:.….\Ognu020′ using 1: 2: 3 with lines
These lines open the window of the gnuplot graph and displays the density profile. Next, if you write the following two lines, the flow velocity profile “u” in the x direction will be displayed.
set zrange [0:2]
splot’C:.….\Ognu020′ using 1: 2: 4 with lines
If you write the following two lines, the flow velocity profile “v” in the y direction will be displayed.
set zrange [-0.5:1.5]
splot’C:.….\Ognu020′ using 1: 2: 5 with lines
Furthermore, if you write the following two lines, the temperature profile will be displayed.
set zrange [0:1.5]
splot’C:.….\Ognu020′ using 1: 2: 6 with lines
Each displayed graph can be rotated by placing the mouse cursor in the gnuplot graph and then using the mouse or arrow keys. However, since the reaction of this software is very slow, it is necessary to operate the graph movement and rotation slowly. For the instructions on each of the above lines, refer to “Help” in gnuplot.
(Result gnuplot graph) Upstream pressure is 760 Torr, U_system.
(a) Density profile

(b) Flow velocity profile in the x-direction

(c) Temperature profile

8. Some examples of calculation time for ‘JET-P3S1’ by various PCs with multi-core or multi-thread processor.
Upstream pressure is 760 Torr, U_system, and the maximum number of threads for each CPU is used. Since this is a small-scale calculation, this tendency does not necessarily apply to large-scale calculations. There is a difference of about 100 sec depending on the number of lines output during the calculation. Depending on whether the recording medium is an HDD or SSD, or M.2 SSD, as well as the type (SATA, NVMe) and the release generation, since the writing speed differs greatly of a large amount of intermediate data to be recorded for continuation calculation, the ending time is also affected by these differences. If your PC is significantly slower than the example below, the BIOS and/or msconfig may have limited the number of threads available and you need to remove that limit.
(1) Tablet PC (Win10) CPU: Celeron-N4120 (4 cores) 4348 sec
(2) 14-inch notebook (laptop) PC (Win7) CPU: i7-3517U (4 threads) 4389 sec
(3) 13-inch notebook PC (Win7) CPU: i7-4510U (4 threads) 4445 sec
(4) 17-inch notebook PC (Win7) CPU: i7-2860QM (8 threads) 2633 sec
(5) 14-inch notebook PC (Win11) CPU: i5-1235U (12 threads) 1656 sec (I asked my acquaintance who has this PC to measure the calculation time)
(6) 16-inch notebook PC (Win11) CPU: AMD-6800H (16 threads) 791 sec
(7) Desktop PC (Win7) CPU: Xeon E3-1280 V2 (8 threads) 1604 sec
(8) Desktop PC (Win10) CPU: Xeon E5-2699 V3 (36 threads) 693 sec
(9) Desktop PC (Win10) CPU: AMD-2990wx (64 threads) 500 sec
(10) Desktop PC (Win10) CPU: AMD-3970x (64 threads) 366 sec
(11) Desktop PC (Win10) CPU: AMD-3990x (64 cores) 302 sec
(64 threads, if 64 threads of another group is not working) 374 sec
(64 threads, if 64 threads of another group is being used to do another job) 404 sec
(128 threads) Not executed because a large program rewrite is required due to Windows restrictions.