(The description in English is shown after the Japanese sentence.)
第4章は「超音速噴流の乱れ解析」と銘打っていますが,実際には,第2章の試し計算で取り上げた計算対象と基本的にほぼ同じプログラムを使います.すなわち,流れは,上流圧力に設定された仮想よどみ点から出発し,円形オリフィスを通過した後,超音速噴流を形成して下流に流れ去ります(オリフィスより下流の初期条件は,下流背圧で静止している状態).ただし,第2章の試し計算では,小さなPCでも比較的短時間で計算終了できるように,粗い空間セルや極端に大きな時間ステップを用いているし,「5.1 DSMC法の概要」で例示したように,オリフィスより上流の空間は省略している.一方,第4章では,噴流の乱れ形状を再現できるように,空間セルの大きさは局所的な平均自由行程になるべく近づけ,時間ステップも,できる限り分子の平均自由時間(平均衝突時間)に近くなるようにしています.もちろん,大気圧に近くなれば平均自由行程や平均自由時間に一致させることなど到底できませんが.このように,第4章での計算は本格的なものであり,それなりに高速なPCを使う必要がありますし,記憶容量には32GBが必要です(計算によっては16GBでも可能).ちなみに,私の場合,64 threadによる並列計算を同時に2つ実行できるCPU(AMD3990x)を主として用いていますが,それでも一つの条件の計算終了には何日もかかります(異なるCPUの計算時間比較は第2章末に例示されている).なお,圧力比の大きい計算は,分子総数が少なくなり比較的早く終了しますし,上流圧力が小さいほど終了は早くなります.さらに,大量の中間データuvw333(最大で約5億個になる分子の位置座標と速度成分の全データ)を時々出力するため,高速なSSDも必要です.また,第2章の試し計算では,上流圧力と下流圧力の比(圧力比)は50に固定していましたが,第4章における圧力比は,2~16まで変化させられます.なお,これ以上の圧力比では,噴流の乱れは大きくならないと考えて,計算領域を小さく抑える必要性から,圧力比は16までに制限しています.なお,上流のよどみ点圧力(絶対圧)は,1mmHg~760mmHg(1気圧)まで変化できます.超音速噴流なら,上流圧力をもっと大きくすべきではないかと考えるかも知れません.しかし,上流圧力がある程度大きく,連続流体と考えられる状況ならば,噴流形状は圧力比だけで決定されると考えて差し支えありません.そもそも,DSMC法は,希薄気体の解析に考案されたもので,その計算限界の圧力は1気圧を少し超える程度までとされています(低い側の圧力には制限はない).対象気体は,アルゴン単一気体です.なぜ空気や燃料気体を使わないのかとの疑問には,計算が複雑になり過ぎるからと答えることになります.アルゴンは単原子分子(一個の原子からなる分子)なので,並進運動だけを考えれば事足りますが,もし,空気を対象としたら,空気は,酸素,窒素,水蒸気等からなる混合気体であるし,酸素や窒素だけをとっても,2原子分子で,並進運動以外に回転運動や高温では振動運動も励起します.とても家庭用のPCで処理できるものではありません.それに,噴流構造を問題にする場合には,アルゴンで十分な場合が多いということもあります.上流圧力1mmHg~760mmHgと圧力比1~16による組み合わせは多岐にわたり,思いがけない結果が出てくるかも知れません.本来なら,個々の状況に応じて,計算のためのプログラムをチューニングするのが良いのでしょうが,今回は,一つの同じプログラムで計算できるようソフトウェアを作成しています.希薄の程度を表現する無次元数にクヌッセン数Knというものがあり,平均自由行程と代表長さの比で定義されます.流れの状態は,Kn<0.01を連続流,0.01<Kn<1を中間流,Kn>1を分子流と呼びますが(異なる定義法もある),流れは,それぞれの領域では同じような性質を示します,今回のシミュレーションにおける代表長さを,噴流が流れ出る円形オリフィスの直径(2.5mm)とすれば,上流よどみ点圧力だけで平均自由行程を決めるならば,760mmHg~1mmHgはKn=2.2×10-5~0.016に相当し,上流では,ほぼ連続流領域に入ります.ただし,オリフィスから流出した後に圧力は急速に減少するので,流れ場全体としては,圧力比で決まる下流圧力も考慮する必要があり,その結果,中間流領域であったり,分子流領域に近い状態になったりすることもあります.
シミュレーションでは初期条件と境界条件が重要ですが,DSMC 法では特に境界条件の設定が重要である.初期条件については,どんなものから始めても,結局最終的にはあるべき姿に収束すると考えてよい.超音速流の解析では,分子はほとんど下流に流れ去るので,上流の境界条件はそれほど問題にはならず,問題なのは下流の境界条件である.本来無限に長くあるべきはずの計算領域を,有限の,しかもなるべく短く小さくなるように領域設定するため,一般的には下流境界付近で結果が大きく歪むことになる.ただしその歪んだ部分だけを計算結果から捨ててしまうということにすれば,計算全体が利用できないわけではない.例えば,飛行機や自動車の風洞実験は,限られた大きさの風洞で実験せざるを得ないが,その結果が全く使い物にならないというものではない.下流境界付近でのひずみを小さく抑える方法は,その境界状態を何らかの方法で予測し,本来あるべき姿に設定することである.例えば下流境界の流速だけを大まかに予測するだけでも歪みは軽減される.その予測に,途中で得られた計算結果を利用するというのは一般的であるが,それによって,計算の収束に時間がかかり過ぎては困る.今回提供するソフトウェアにおける下流境界近傍のひずみの生じる長さは,結果表示した領域長さの10%程度以下に抑えたつもりであるが,全くゼロというものではないので,その点は注意してほしい.
U-sys法は,「セル内での流速分布と温度分布を予測して与え,衝突する2つの分子の衝突前後の速度を補正する」という手法により,空間セルを大きくとっても,見かけ上,セルを小さくしたと同じ効果を出そうというものである.しかし,セル内の流速や温度は計算が済んで初めて得られるものなので,何らかの方法により,これを予測しなければならない.DSMC法は基本的に非定常計算なので,予測のもっとも簡単な方法は,一回前の時刻の流速と温度のデータを使うことである.しかし,非定常変化が大きい場合には,それは当然計算誤差となる.それを防ぐためには,時間ステップを小さくとることであるが,そうするとサンプル分子数が少なくなり,今度は,そのための誤差が発生する.次に考えられるのは,一回前と二回前のデータを使って予測する方法であるが,予測式を誤ると計算が不安定になってしまうことも起こる.安全な方法は,一回前のデータを使って仮の計算を行い,その結果を用いて本計算を実施するというものであるが,計算時間は確実に2倍必要となる.下記で紹介する計算例では,上記の,(1)基本的方法,(2)時間ステップ1/2,(3)時間ステップ1/4,(4)二つのデータによる予測法,(5)仮・本計算法,(6)仮・本計算を時間ステップ1/4で用いた方法,のそれぞれを実施し,比較を行っているので参考にしてほしい.それぞれに特徴があるので,今のところ私から,これが良いと判断することはできません.またU-sys法は,双線形補間法という近似計算も使っているので,そこにも改善を行う必要があるかも知れません.そもそも,乱れの計算は三次元現象として解析すべきところを,軸対称を仮定して行っているので,ある部分だけを厳密にしても,それがどれほどの意味を持つかは慎重に考察する必要がある.これら,もっと良い方法を皆さんに考えて頂くのは大歓迎です.
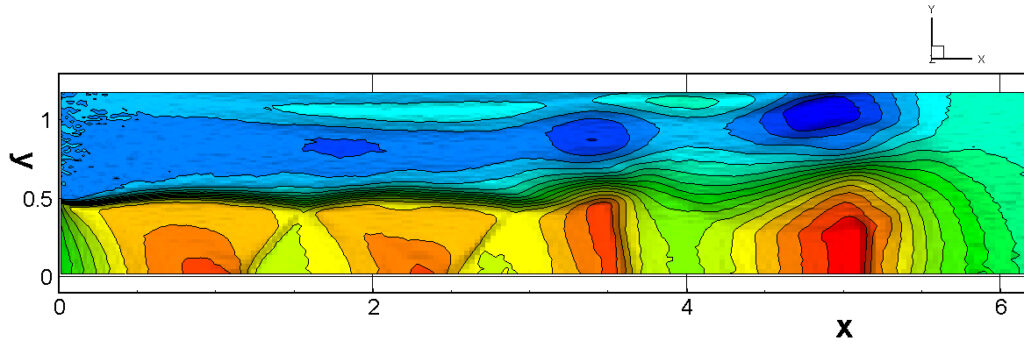
出力データ(9個)の並びは,x 座標,y 座標(r座標),数密度 N,流速 u,N.u(数密度×流速),温度 T,x方向温度 Tx,yz方向温度 Tyz,マッハ数 M となります.長さは円形オリフィスの直径(代表長さ)によって無次元化され,速度は分子の最大確率速度によって無次元化されています.また,数密度と温度はそれぞれの初期値で無次元化されます.
●計算の実際
以下に,超音速噴流の乱れ解析を行う計算の手順を述べるが,計算の前提として,「2. 試し計算」の項目の内容を熟知し,実際にその計算を体験しているものとして話を進めるので,もしそうでない場合は,先に「2. 試し計算」を実行して,問題なく結果が得られるかどうかを確かめてください.また,できれば,3.1および3.2に記載した「円筒管内の流速分布の計算」も体験していただいているとよいと考えます.
(A) 計算に必要なファイル
計算に必要な5つのファイルは,①計算ソフトウェア本体(P22-S3.exe),②65個の乱数列の初期値ファイル(ransuuM65),③一次結果ファイルを二次結果ファイル(作画ファイル)に変換するソフトウェア(OUT09B-62S.exe),④定常状態達成後の一連の作画ファイルを加算して平均するためのソフトウェア(AVE3-JETS.exe),⑤その他のファイル1つ(libiomp5md.dll).それらは,1つの圧縮ファイル Supersonic Jet (SS-Jet) に保存してあるので,「2. 試し計算」のときと同様に,それをダウンロードしたのち,解凍作業を行って5つのファイルに戻します.ダウンロードフォルダ内あるいはデスクトップ上に SS-Jet というフォルダができ,その中に5つのファイルが入っているので P22-S3.exe を実行する.実行しようとした際,もし,Microsoft Defender SmartScreen が「SmartScreenを使用できません」と言ってきても,SmartScreenは賢くないので,気にせず,「実行」してください.なお,計算実行が行われるコマンドプロンプト画面は,そのプロパティのウィンドウ幅を150以上にすると見やすい表示になる.
(B) 計算の開始(キーボードから複数のデータを入力)
①「2. 試し計算」の場合と同様の手順で,計算ソフトウェア本体(P22-S3.exe)を立ち上げ,初めての計算の場合は 0 を,継続計算の場合は 1 を入力します.継続計算の場合は,uvw333やtfile2 等のファイルがすでに作られている必要があります.継続計算を選択した場合,元の計算条件(上流圧力,圧力比,計算手法)が表示されるので,問題がなければ,Enterキーを押すと計算が再開される.もし問題があれば,CtrlキーとCを同時に押して中断する.なお,uvw333やtfile2は非常に大きなファイルなので,継続計算の必要がなくなったら削除するように心掛けてください.
②初めての計算の場合は,使用しているPCのスレッド数が表示されるので,その数値以下の数字を,実際に使用するスレッド数として入力します.1から最大値の範囲以外の値が入力されると,最大値が選択されます(推奨値は最大値です).
③上流よどみ点の圧力を1~760 mmHg(Torr)の範囲内で入力します.1未満の場合は1に,760を超える場合は760に制限されます.
④圧力比(上流圧力と下流背圧の比)を2~16の範囲で入力します.2未満の場合は2に,16を超える場合は16に制限されます.
⑤Bird法で計算するか,U-system(U-sys法)で計算するかを選択します.基本的には,U-sys法で計算してほしいですが,Bird法でしか計算したくないという人のためにBird法も付けてあります(計算速度はBird法が優れますが,結果はあまり期待できません).
⑥U-sys法を選ぶと,先に述べたように,U-sys法の下記6種類が選択できます.どれを選んだらよいか迷ったならば,まずは,(1)基本的方法 を選んでください.圧力や圧力比の条件によっては,計算が途中で迷走することがあるかも知れません.そのときも,(1)基本的方法 を選んでください.
(1)基本的方法, (2)時間ステップ1/2, (3)時間ステップ1/4,
(4)二つのデータによる予測, (5)仮・本計算法,
(6)仮・本計算を時間ステップ1/4で用いた方法
DSMC法における分子移動と分子間衝突の分離時間(最小時間刻み)は,今回0.005 μsで固定しているので,200ステップで一つの途中結果を出力すると,1 μs毎の計算結果が得られますが,1/2(100ステップ)あるいは1/4(50ステップ)の時間ステップの場合は,その1/2(0.5 μs)あるいは1/4(0.25 μs)となります.その場合,当然サンプル分子数が少なくなるので,統計的変動を同じにするために,連続する2つあるいは4つの出力を1つにまとめれば(後述のOUT09B-62S.exeを参照),1 μs毎の計算結果にすることができます.
⑦Bird法あるいはU-sys法の選択を終えると,確認のため,上流圧力,圧力比,計算手法が表示されるので,問題がなければ,Enterキーを押すと計算が開始され,何秒か後に1ステップ毎の計算に入る.間違っていたら,CtrlキーとCを同時に押して,もう一度最初から実行する.計算開始と同時に,計算条件を示した ”Setting Condition” というファイルが出来上がるので,その内容はあとで記録として役立つが,ファイルができた時刻も計算開始時刻としての記録になる.
(C) 計算実行時の様子
計算実行中に注意することは,その時点で計算がどこまで進んでいるか(計算開始から何μs経過した時刻の計算をしているか)や,結果のファイルが順調に出力されているかということです.まず,画面表示の中で,次の表示部分に注目してください.
——————————————————-
@@ PTOR= ….. PRAT= …..
——————————————————-
最初の数字は上流圧力,二番目は圧力比,三番目は計算手法を示しています.その行の後ろから3つ目の数字は計算に使用しているスレッド数です.次からの各行は,最初に何回目の時間ステップかを,次にμsで表示した時刻を示します.ただし,仮・本計算法(Usys5あるいはUsys6)の場合は,一番先頭にA(仮計算)あるいはB(本計算)が示されます.ただし,1回目の結果出力は,A(仮計算)だけで行われます.他の画面表記の説明は省略します.計算が進行するにつれて,同じフォルダの中にAA04c…という一次結果ファイルが順番に作られます.それと同時に,継続計算のためのuvw333やtfile2等のファイルが出力されます.
(D) OUT09B-62S.exe で得られる二次結果ファイル (描画ファイル)
作成された一次結果ファイル(AA04c…)は,OUT09B-62S.exeによって.結果の作図が可能な二次結果ファイル(DOWN+xxx-yyy)に書き換えることができ,超音速噴流がどこまで成長したか等を調べることに使えます.この書き換えの作業は,実際のDSMC計算とは別に,順次行っていく必要があります.一連のDSMC計算をいつ終了するかについても,時々刻々の噴流形状を作図して判断します.
OUT09B-62S.exeを起動し,最初に,作図データを gnuplot 用にするか tecplot 用にするかを入力します.さらに,データ処理する最初の一次結果ファイルの下3桁(あるいは下2桁) の番号を入れ(先頭のゼロは不要),次いで,最後の一次結果ファイルの番号,そして何個ずつ平均するか(通常は1を入れれば1 μs毎の結果となる.ただし,時間ステップ1/2の場合は2を,時間ステップ1/4の場合は4を入れて1 μs毎の結果にする)の順で入力する.もちろん1 μs毎以外で結果を求めることも可能です.なお,平均個数が1以外のときに,データ総数が平均個数で割り切れないと最後にエラーが出て中断します.そのエラーが出なければ,一番最後に1を入力することにより,一次結果ファイルを自動削除することができますが,エラーで中断した場合には,一次結果ファイルは,手動で削除しなければなりません.一次結果ファイルは結構大きいので,不要になったら削除し,むやみに蓄積させないように注意してください.
また,AVE3-JETS.exeを使えば,二次結果ファイル(作画ファイル)を加算して平均し,長い時間平均した結果を作成することもできます.例えば,DOWN-301-304, DOWN-305-308, ….. , DOWN-337-340 の 10個のデータが得られていたとします.それらを平均するためのソフトウェア(AVE3-JETS.exe)を起動して,まずデータが gnuplot 用か tecplot 用かの判別を入力し,次いで,開始番号の301,1つのデータ幅の4,データ数の10 を順に入力すれば,1-AVE==301-340 という名前で長時間の平均ファイルが作成されます.
第3章「円筒管内の流速分布」で説明したように、私が専ら使用しているtecplotには、結果の各図を次々につなげてアニメーションを作成する機能がありますが、gnuplotにはこの機能がないので、gnuplotの結果からアニメーションを作成するには、インターネット上で公開されている無料のアニメーション作成ソフトを探して、それを利用してください。最後に、これまでに計算した結果の一部を掲載します(掲載例については,断りなく転載していただいて結構ですが,出典元 ‘DSMC calculation by M.Usami (https://usamimas.net)’ を明示していただくようお願いいたします.他の章の記述についても同様です).いずれもかなりの計算時間を必要としますが、今回公開したソフトウェアで計算できますので、ぜひ試して比較してみてください。なお、ここではgnuplotの作図例は示しませんので、gnuplot作図例については第2章、第3章を参照してください。
(E) 計算例 Calculation examples
① p=760mmHg, p_ratio=16, U-sys_1
② p=760mmHg, p_ratio=11, U-sys_1
③ p=760mmHg, p_ratio=7, U-sys_1
④ p=760mmHg, p_ratio=4, U-sys_1
⑤ 前述のUsys1の結果と比較するために,以下に,Usys6(時間ステップ1/4の仮・本計算法)を使用して行った圧力比 4 の結果(動画)を示します.
To compare with Usys1, the results (video) for pressure ratios of 4, calculated using Usys6 (temporary/actual calculation method with time step 1/4), are shown below.
⑥ p=760mmHg, p_ratio=2, U-sys_1
⑦ 前述のUsys1の結果と比較するために,以下に,Usys6(時間ステップ1/4の仮・本計算法)を使用して行った圧力比 2 の結果(動画)を示します.
To compare with Usys1, the results (video) for pressure ratios of 2, calculated using Usys6 (temporary/actual calculation method with time step 1/4), are shown below.
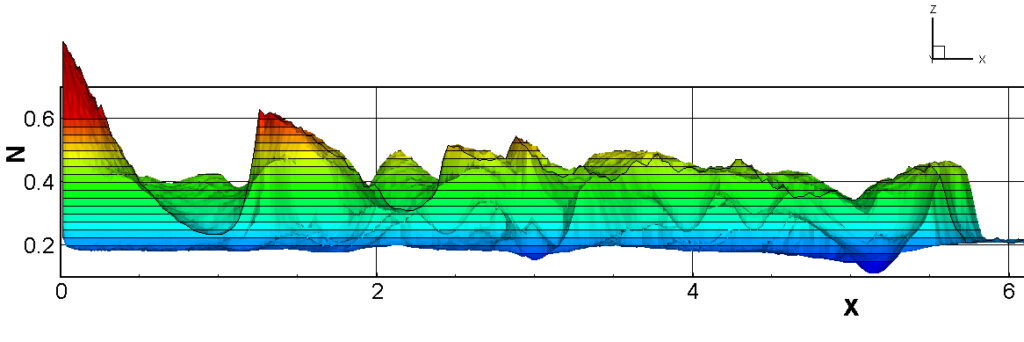
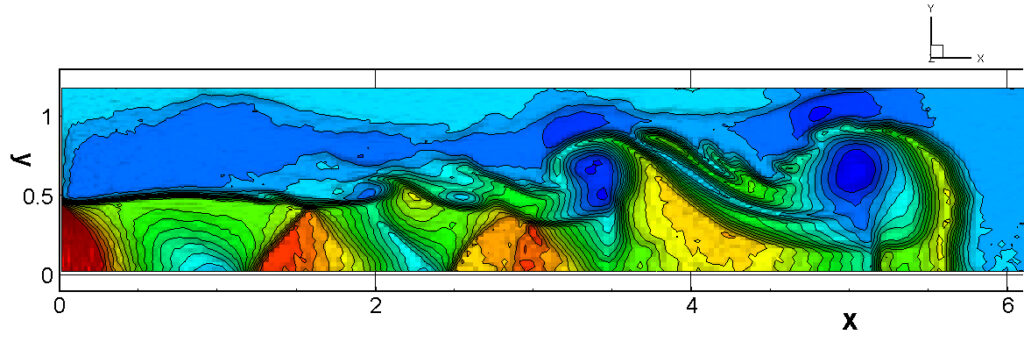
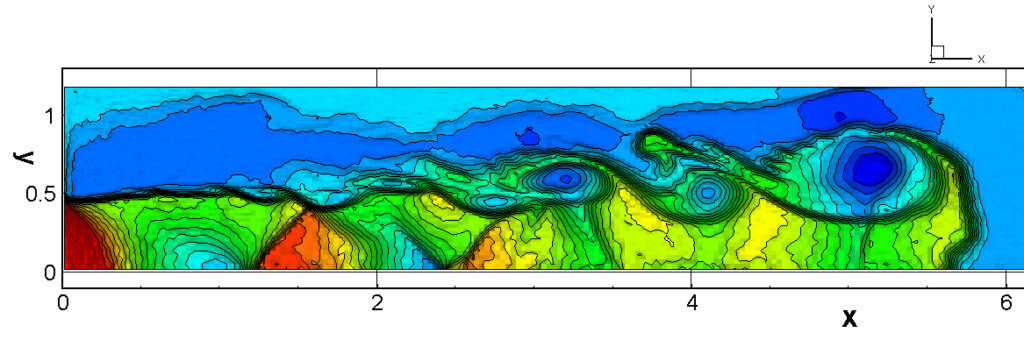
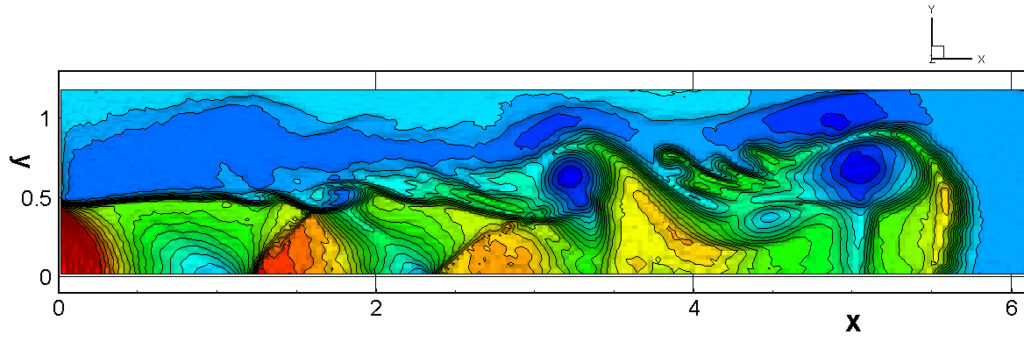
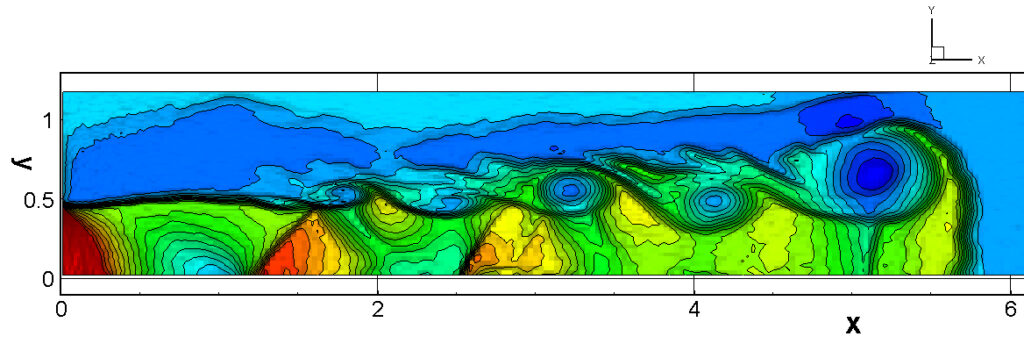
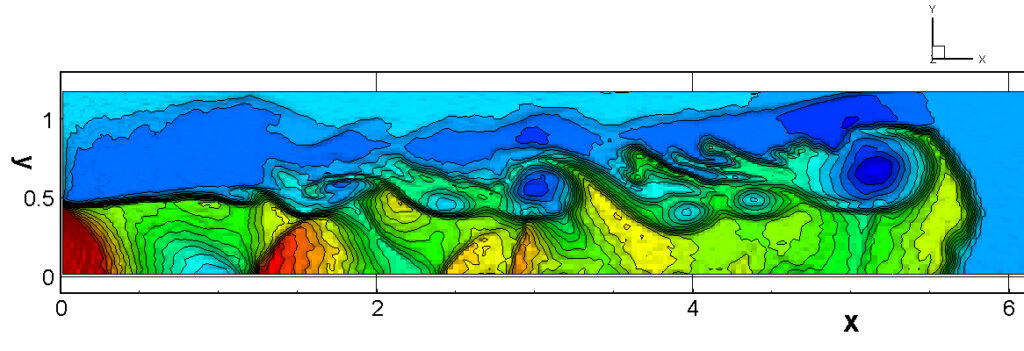
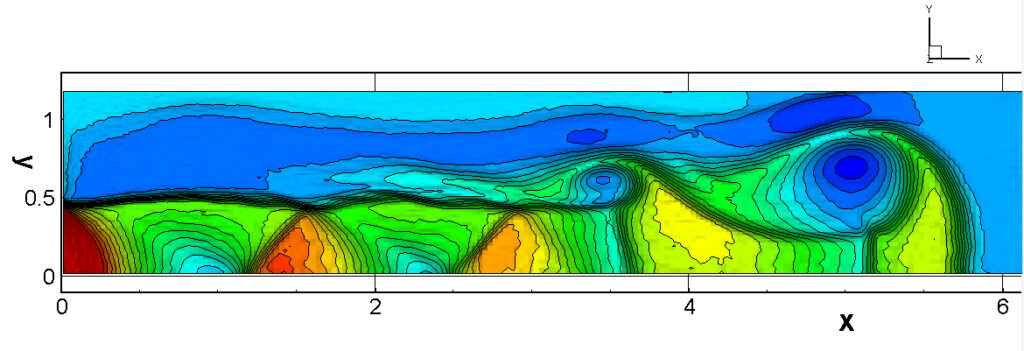
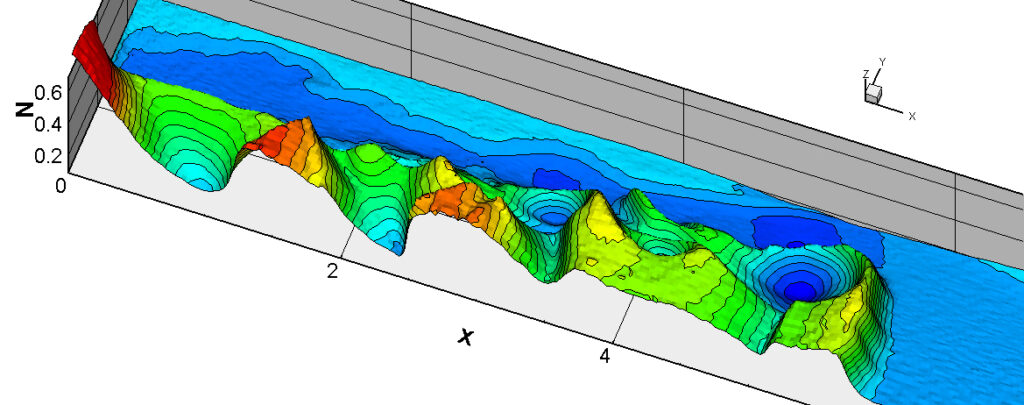
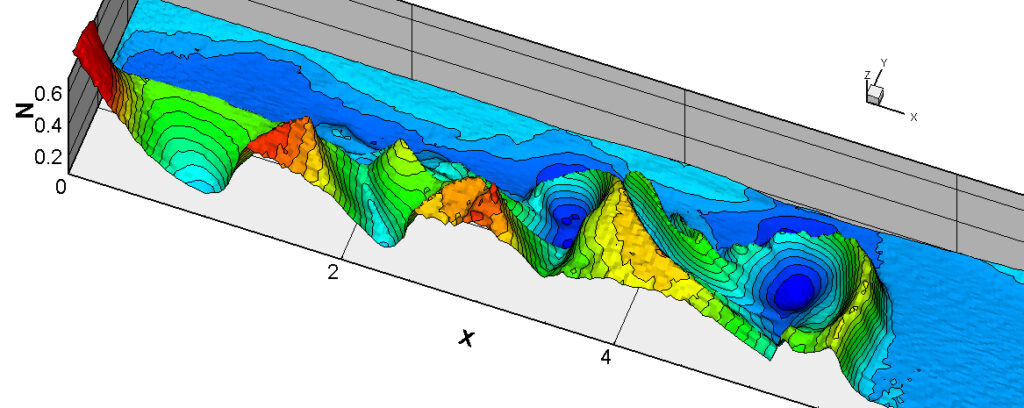
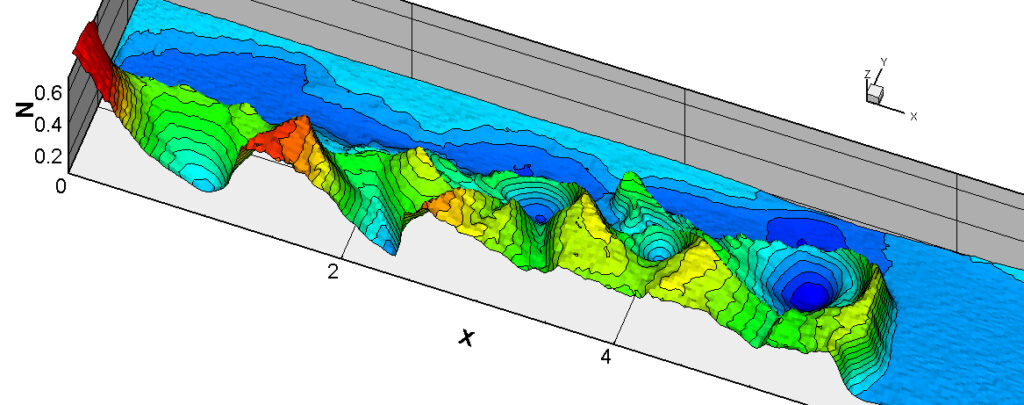
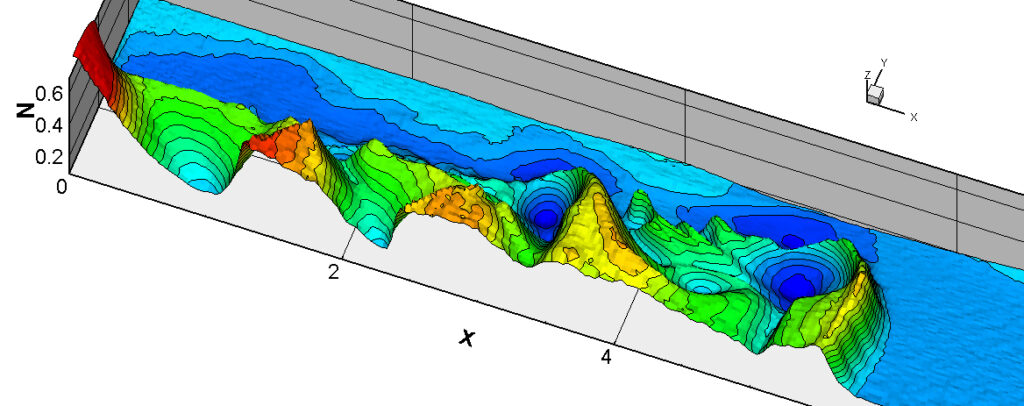
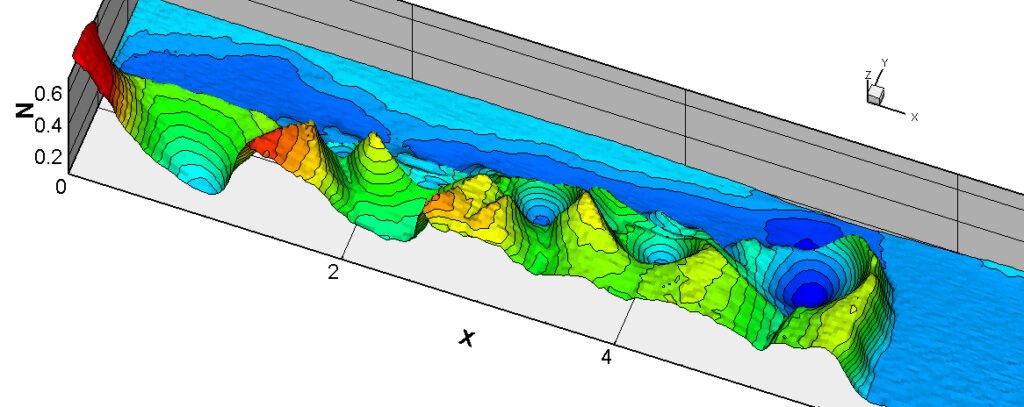
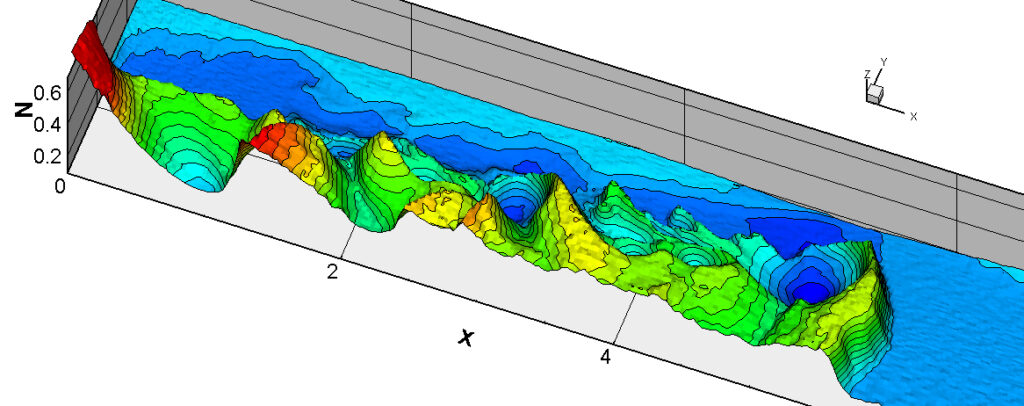
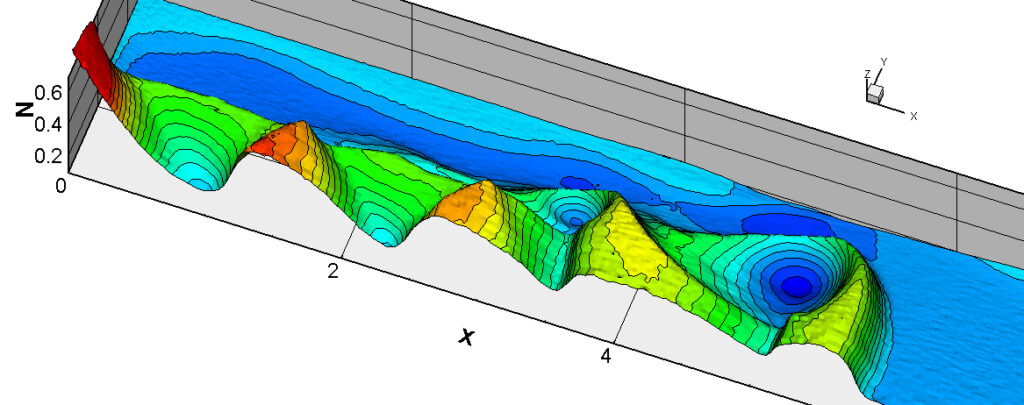
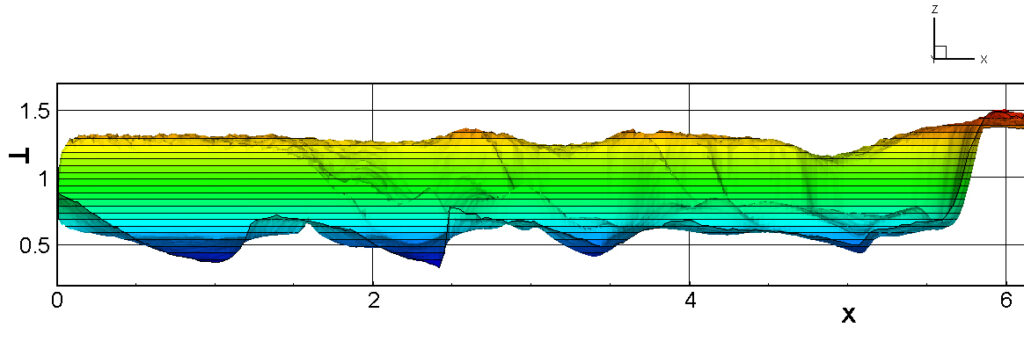
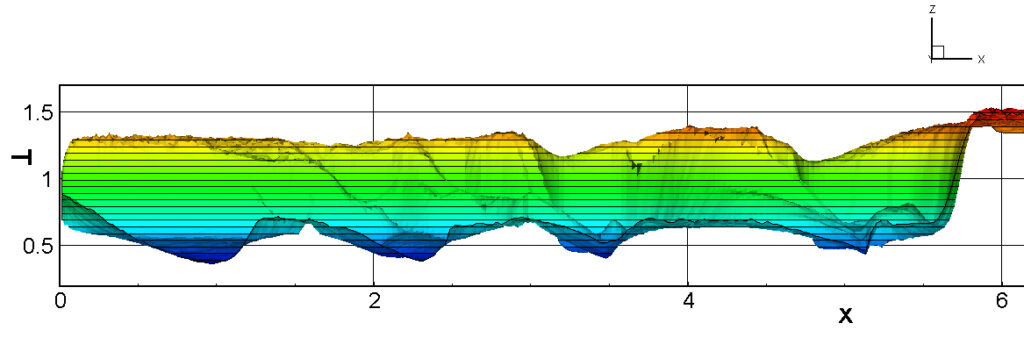
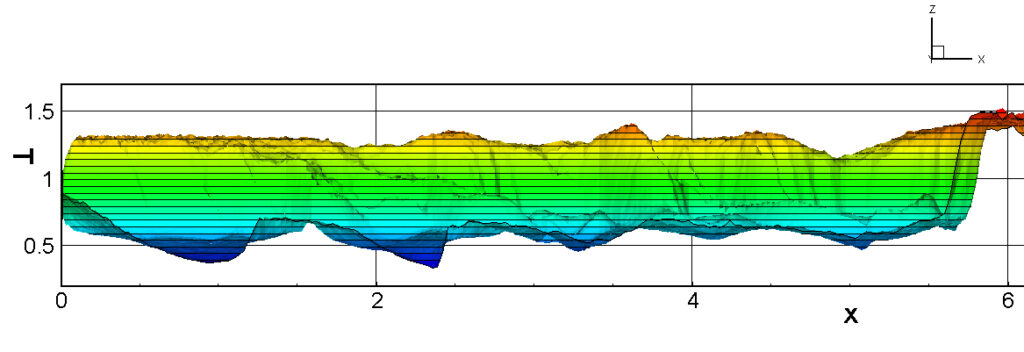
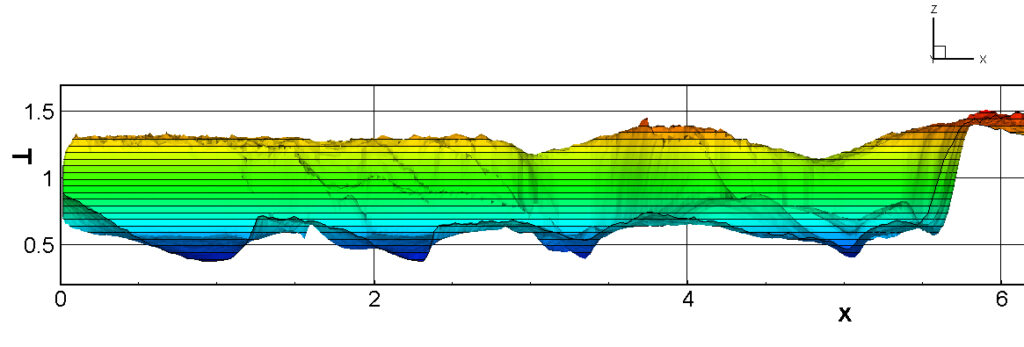
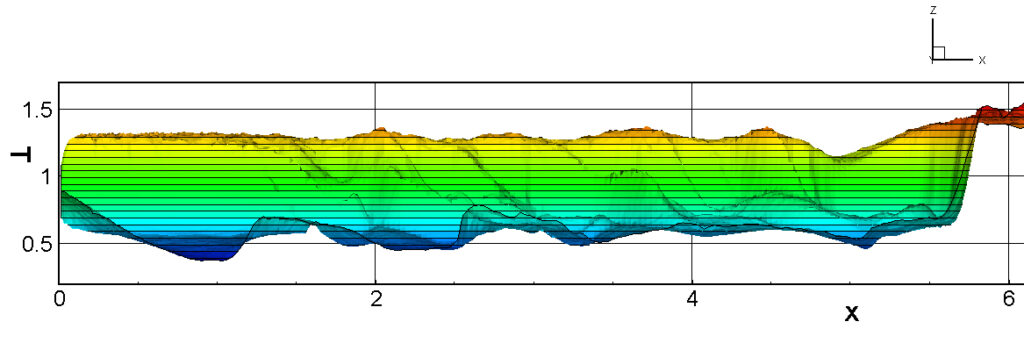
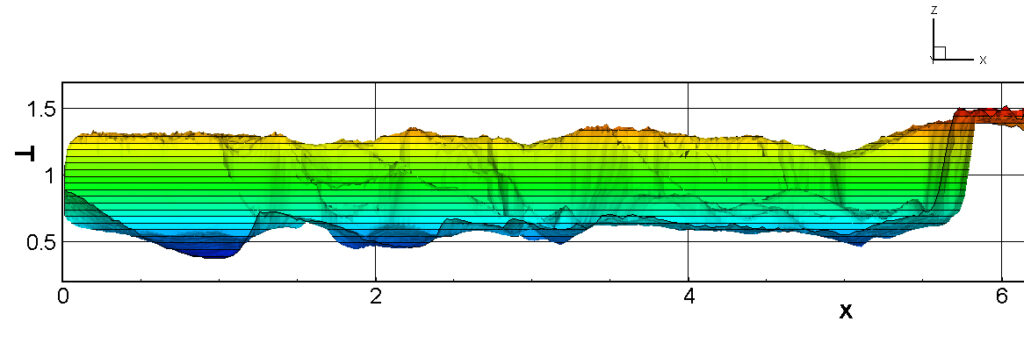
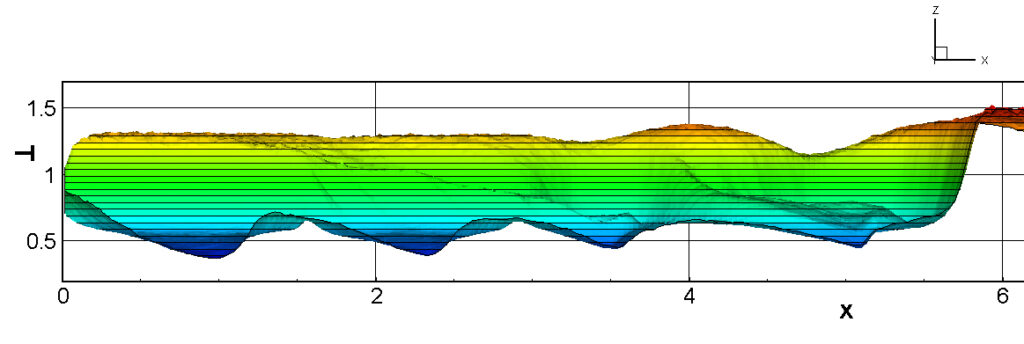
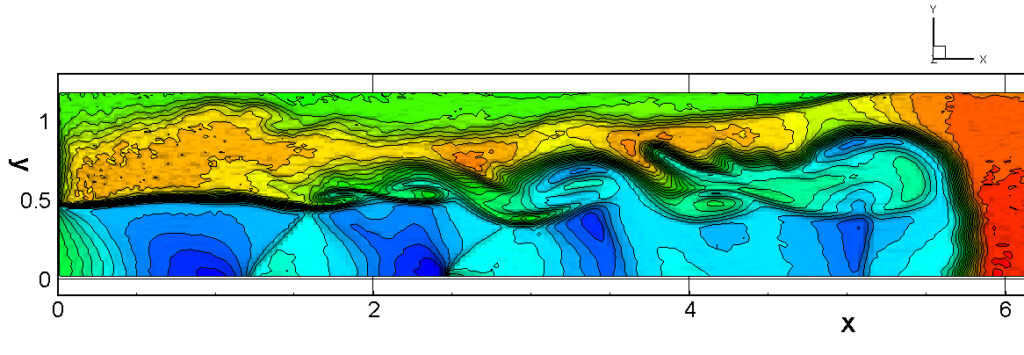
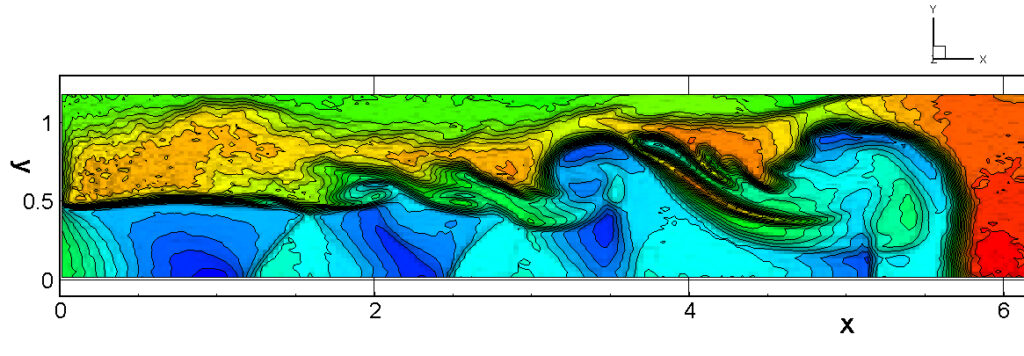
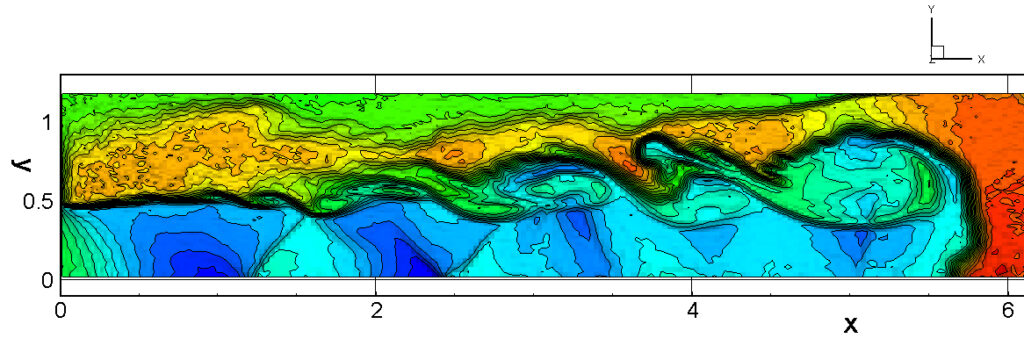
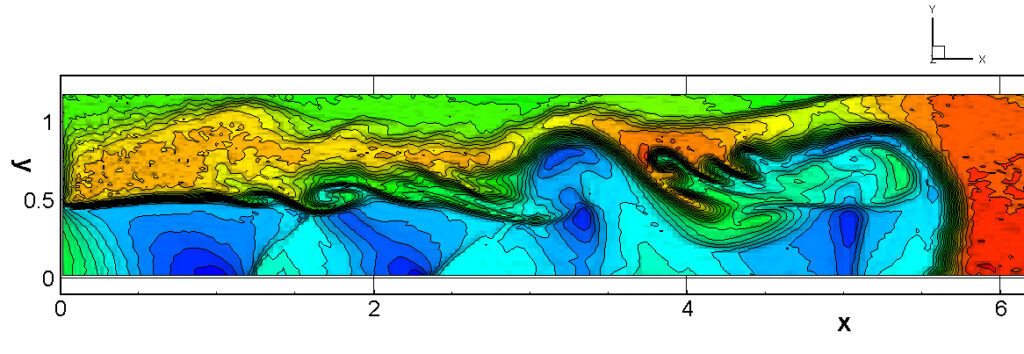
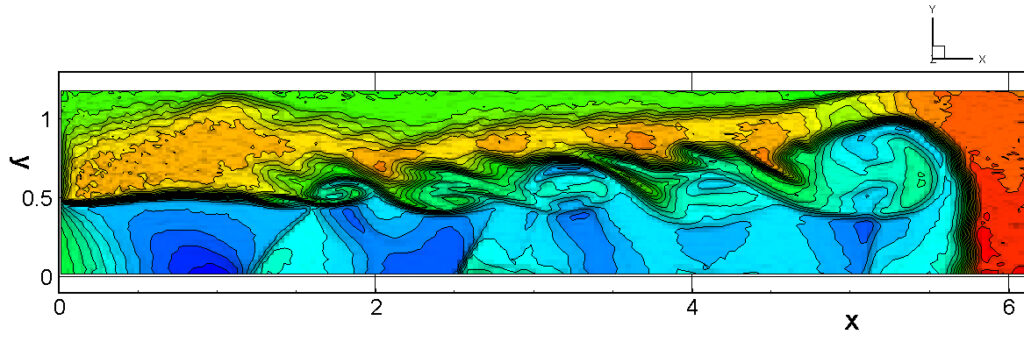
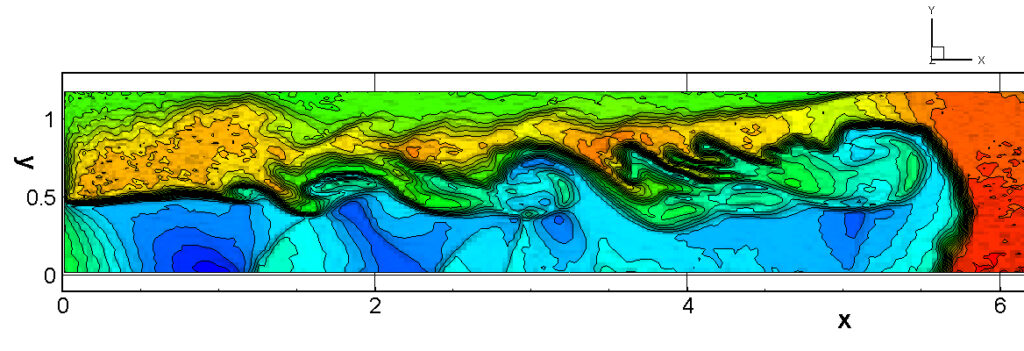
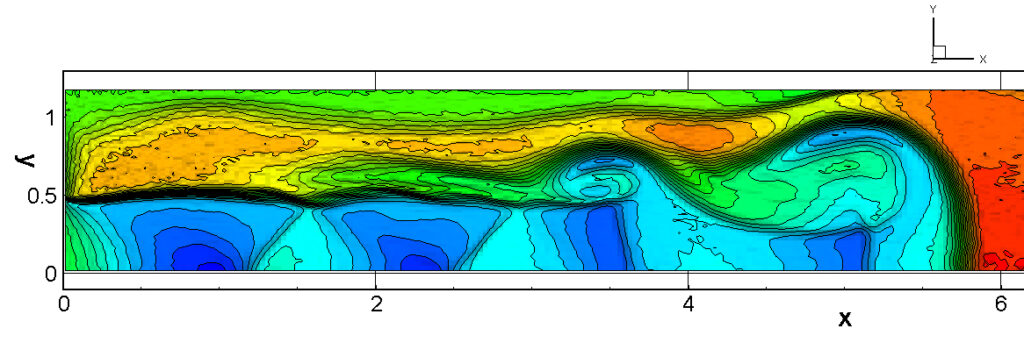
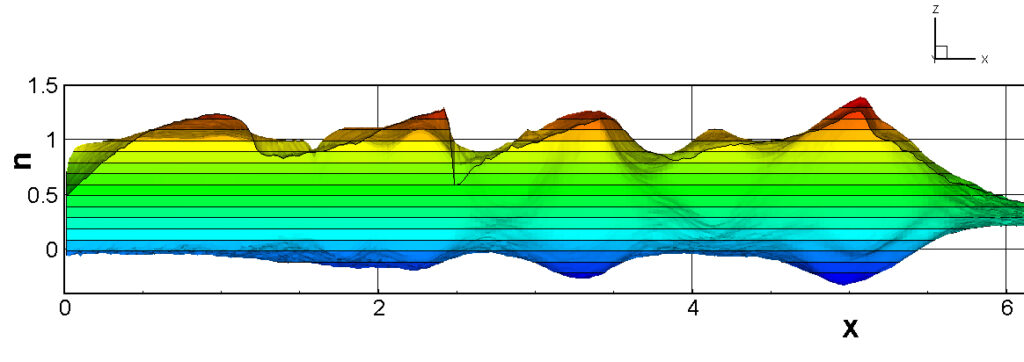
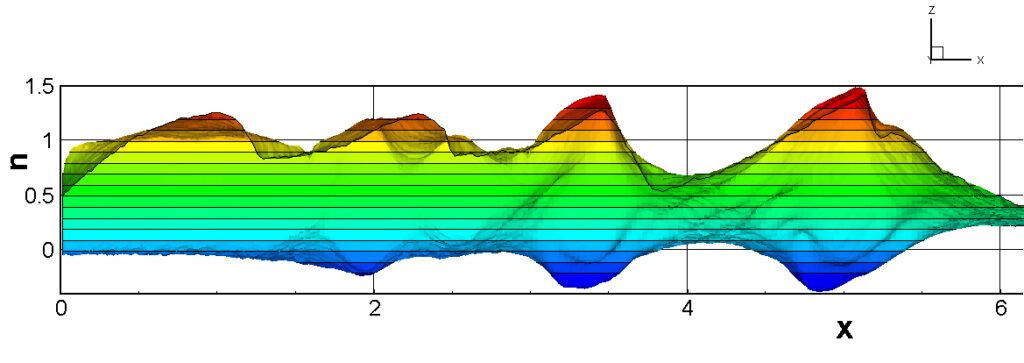
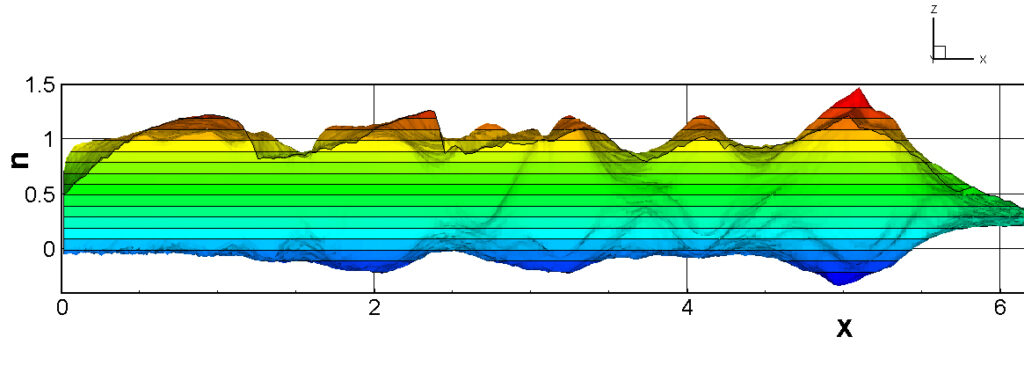
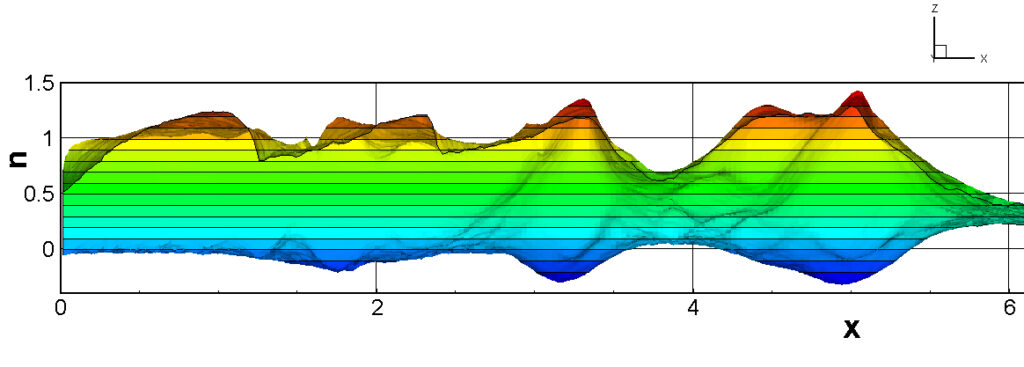
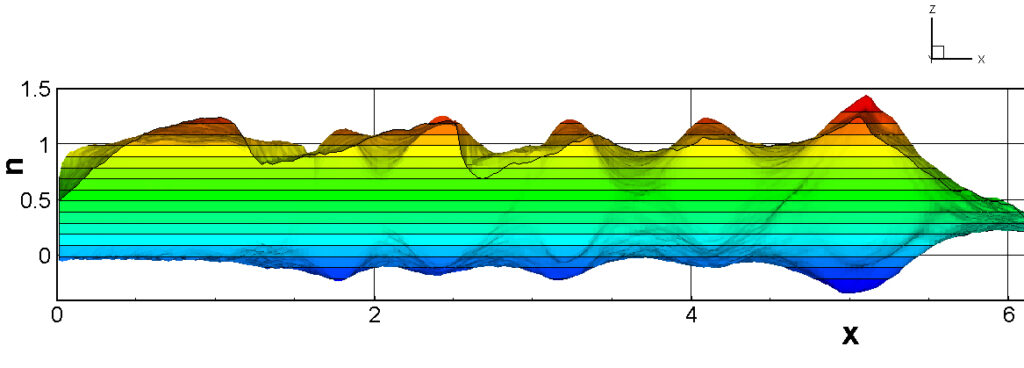
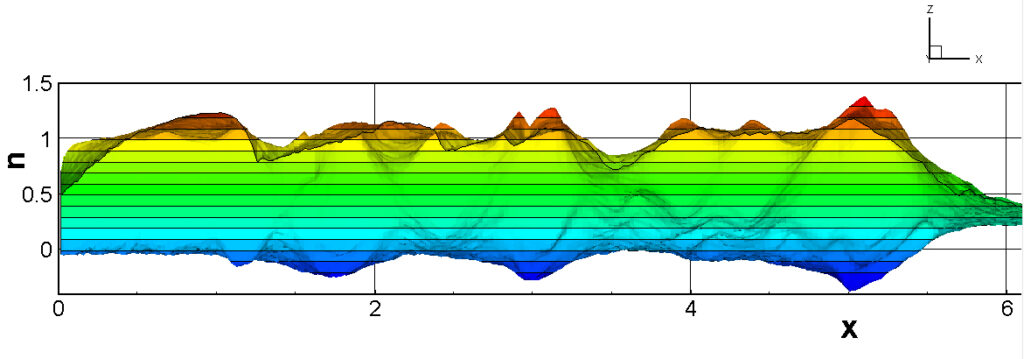
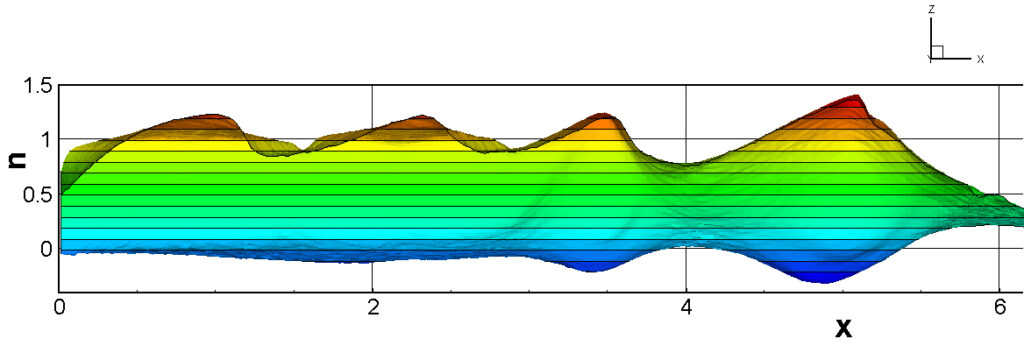
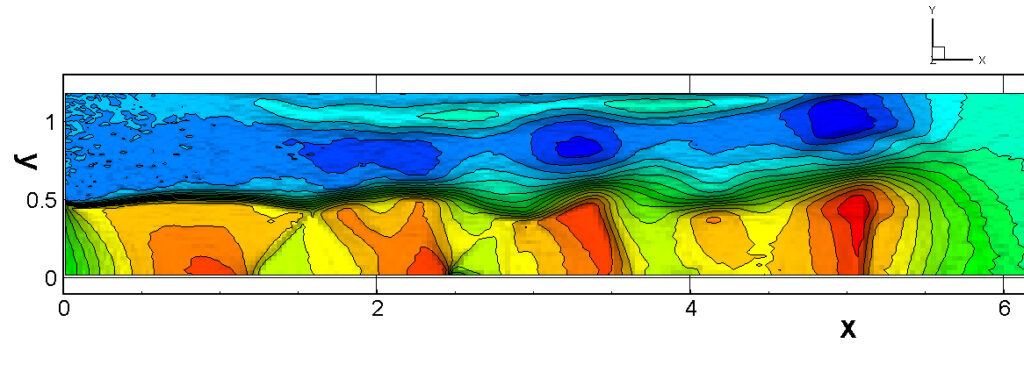
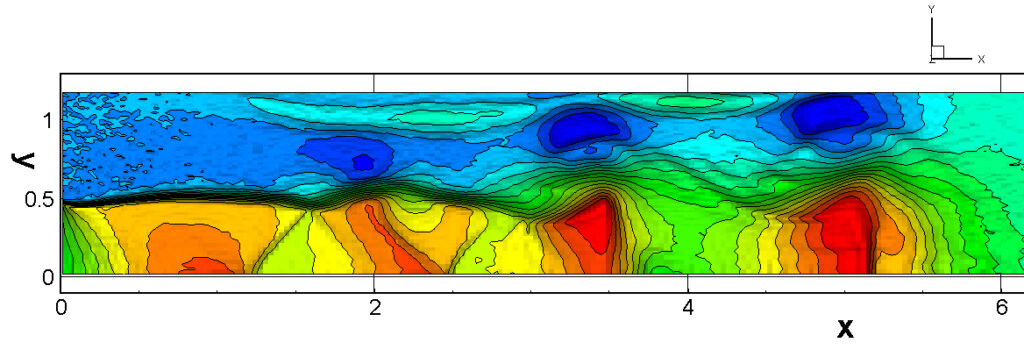
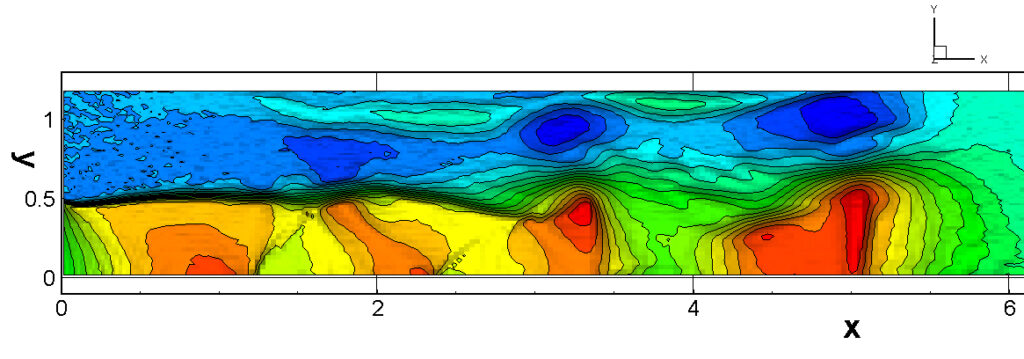
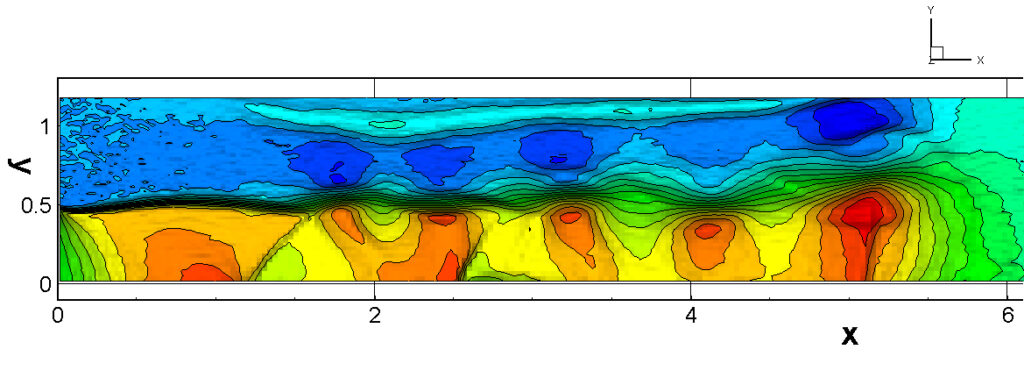
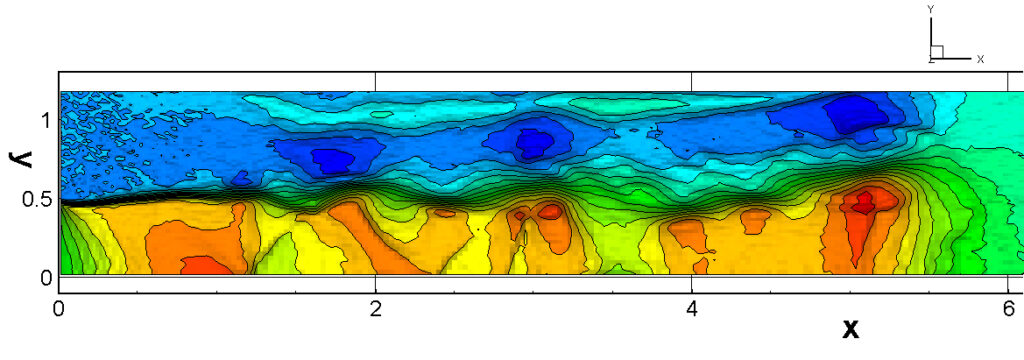
⑧ 上流圧力760mmHg,圧力比4 について,異なる手法(Usys1~6, Bird method)を用いて得られた同時刻の結果(噴流流出開始から70μs後の静止画像)を,手法の比較のために示します.それぞれ特徴があり,一概に,どれが優れているかを明言できませんので,皆さんで優劣を判断してください.
For comparison, still images obtained at the same time (70μs after the start of jet flow) using different methods with an upstream pressure of 760 mmHg and a pressure ratio of 4 are shown. Each has its own characteristics, and it is not possible to say which is better, so please judge for yourself which is better.





Although Chapter 4 is titled “Analysis of Turbulence in Supersonic Jets,” in reality, we use a program that is basically the same as the one used in the test (trial) calculation in Chapter 2. That is, the flow starts from a virtual stagnation point set to the upstream pressure, passes through a circular orifice, and then forms a supersonic jet and flows downstream. The initial condition downstream of the orifice is at rest with downstream back pressure. However, in the test calculation in Chapter 2, coarse spatial cells and extremely large time steps were used so that the calculations could be completed in a relatively short time even on a small PC, and as illustrated in “5.1(e) Overview of the DSMC Method”, the space upstream of the orifice is omitted. On the other hand, in Chapter 4, the size of the spatial cells is made as close as possible to the local mean free path, and the time step is made as close as possible to the mean free time (mean collision time) of the molecules so that the turbulent shape of the jet can be reproduced. Of course, if the pressure is close to atmospheric pressure, it is impossible to match the mean free path or mean free time. As such, the calculations in Chapter 4 are serious, so a reasonably fast PC is required, and 32GB of memory is required (16GB is possible for some calculations). By the way, in my case, I mainly use a CPU (AMD3990x with 128 threads) that can execute two independent calculations at the same time using each 64 threads, but even so, it takes days to complete a calculation under any condition (a comparison of calculation times for different CPUs has been shown at the end of Chapter 2). Calculations with a large pressure ratio will end relatively quickly because the total number of molecules is smaller, and the smaller the upstream pressure, the sooner it will end. In addition, a large amount of intermediate data uvw333 (all data on the position coordinates and velocity components of molecules, up to a maximum of about 500 million) is output from time to time, so a high-speed SSD is also required. In addition, in the test calculations in Chapter 2, the ratio of the upstream pressure to the downstream pressure (pressure ratio) was fixed at 50, but in Chapter 4, the pressure ratio can be changed from 2 to 16. Note that the pressure ratio is limited to 16 because it is necessary to keep the calculation area small, as it is thought that the turbulence of the jet will not increase at a pressure ratio higher than this. The upstream stagnation pressure (absolute pressure) can vary from 1mmHg to 760mmHg (1 atm). For a supersonic jet, one might think that the upstream pressure should be larger. However, if the upstream pressure is large enough that the flow condition is considered to be a continuum flow region, it is fine to assume that the jet shape is determined only by the pressure ratio. The DSMC method was originally devised for the analysis of rarefied gases, and its calculation limit pressure is set to a little over 1 atm (there is no limit on the lower pressure). The target is a simple argon gas. The question of why air or fuel gases are not used is answered by the fact that the calculations would be too complicated. Argon is a monoatomic molecule (a molecule consisting of one atom), so it is sufficient to consider only translational motion, but if air is the target, air is a mixed gas consisting of oxygen, nitrogen, water vapor, etc., and even if considering only oxygen and nitrogen, they are diatomic molecules that have rotational mode in addition to translational motion, and at high temperatures also vibrational mode. It is not something that can be processed on a home PC. Additionally, when the jet structure is of concern, argon is often sufficient. There are a wide variety of combinations of upstream pressures from 1mmHg to 760mmHg and pressure ratios from 1 to 16, which may lead to interesting results. Ideally, it would be best to tune the calculation program according to each individual situation, but this time we have created software that allows any calculation to be performed with one program. The Knudsen number Kn is a nondimensional number that expresses the degree of rarefaction, and is defined as the ratio of the mean free path to the characteristic length. The flow state is called continuum flow when Kn<0.01, tranditional flow (intermediate flow) when 0.01<Kn<1, and molecular flow when Kn>1 (there are other definitions), but the flow shows similar properties in each region. If the characteristic length in this simulation is the diameter of the circular orifice from which the jet flows out (2.5 mm), and if the mean free path is determined only by the upstream stagnation pressure, 760mmHg to 1mmHg corresponds to Kn = 2.2 × 10⁻⁵ to 0.016, and the upstream is almost in the continuum flow region. However, since the pressure decreases rapidly after flowing out of the orifice, the downstream pressure determined by the pressure ratio must also be taken into consideration for the entire flow field, and as a result, it may be in the transitional flow region or close to the molecular flow region.
Initial conditions and boundary conditions are important in simulations, but in the DSMC method, the setting of boundary conditions is especially important. Regarding the initial conditions, it is fine to consider that the flowfield will eventually converge to the desired state no matter what the calculation is started with. In the analysis of supersonic flow, most of the molecules flow downstream, so there is no need to pay much attention to the upstream boundary conditions, but the downstream boundary conditions are important problem. The calculation domain, which should be infinitely long, is set to be finite, and as short and small as possible, so the results generally become significantly distorted near the downstream boundary. However, if the distorted area is discarded from the calculation results, the entire calculation is not unusable. For example, wind tunnel experiments for airplanes and automobiles have to be conducted in wind tunnels of limited size, but the results are not completely useless. The method to keep distortion near the downstream boundary small is to predict the boundary condition in some way and set it to the way it should be. For example, distortion can be reduced by simply roughly predicting the flow speed at the downstream boundary. It is common to use calculation results obtained along the way for the prediction, but this can cause problems if it takes too long for the calculation to converge. In the software provided this time, we have tried to suppress the length where distortion occurs near the downstream boundary to less than about 10% of the domain length displayed in the results, but please note that it is not completely zero.
The U-sys method is a method of “predicting and giving the flow velocity and temperature distribution within the cell, and correcting the velocity before and after the collision of two colliding molecules”, which aims to achieve the same effect as making the cell smaller even if the spatial cell is large. However, since the flow velocity and temperature within the cell can only be obtained after the calculation is completed, they must be predicted in some way. Since the DSMC method is basically a unsteady calculation, the easiest way to predict is to use the flow velocity and temperature data from the previous time step. However, if the unsteady change is large, it will naturally result in a calculation error. To prevent this, the time step is made small, but this reduces the number of sample molecules, which in turn generates errors. The next method that can be considered is to predict using the data from one and two times before, but if the prediction formula is incorrect, the calculation may become unstable. A safe method is to perform a provisional calculation using the previous data and then use the result to perform the actual calculation, but this will definitely require twice the calculation time. In the calculation example introduced below, as above mentioned, (1) basic method, (2) time step 1/2, (3) time step 1/4, (4) prediction method using two data, (5) provisional and actual calculation method, and (6) method using provisional and actual calculation with a time step of 1/4 are performed and compared, so please use them as a reference. Each method has its own characteristics, so at this point I cannot judge which one is better. In addition, the U-sys method also uses an approximate calculation called bilinear interpolation, so there may be a need to improve that as well. In the first place, calculations of turbulence should be analyzed as a three-dimensional phenomenon, but they are performed using axisymmetric approximation. Therefore, even if certain parts are made precise, careful consideration must be given to how much meaning this has. I would be very happy if you could come up with a better method.
The output data (9 items) are arranged as follows: x coordinate, y coordinate (r coordinate), number density N, flow velocity u, product of number density and flow velocity N.u, temperature T, x-direction temperature Tx, yz-direction temperature Tyz, and Mach number M. The length is normalized by the diameter of a circular orifice (characteristic length), the velocity is normalized by the most probable molecular thermal speed, and the number density and temperature are normalized by their respective initial values.
●Actual calculation
Below, we will explain the calculation procedure for turbulence analysis of a supersonic jet, but we will proceed assuming that you are familiar with the contents of “2. Test (trial) calculation” and have actually performed that calculation. If you are not, please first perform “2. Test calculation” and check whether you can obtain the results without any trouble. It is also recommended that you have experience with “Simulation of flow velocity profile in a circular tube” described in 3.1 and 3.2, if possible.
(A) Files required for calculation
The five files required for calculation are: ① Calculation software main body (P22-S3.exe), ② Initial value file for 65 random number sequences (ransuuM65), ③ Software to convert primary result files to secondary result files (drawing files) (OUT09B-62S.exe), ④ Software to add and average a series of drawing files after the steady state is achieved (AVE3-JETS.exe), and ⑤ One other file (libiomp5md.dll). These are saved in a single compressed file ‘Supersonic Jet (SS-Jet)’, so after downloading it, unzip it and return it to the five files, just like in “2. Test calculation“. A folder called SS-Jet will be created in the download folder or on the desktop, and the five files will be inside it, so run P22-S3.exe. If Microsoft Defender SmartScreen says “SmartScreen cannot be used” when you try to run P22-S3.exe, SmartScreen is not smart, so don’t worry and just click “Run (Execute)”. Note that the command prompt screen where the calculation is performed will be easier to see if you set the window width in the properties to 150 or more.
(B) Starting the calculation (entering multiple data from the keyboard)
① Start the calculation software (P22-S3.exe) in the same way as in “2. Test calculation“, and enter 0 for the first calculation or 1 for continued calculation. For continued calculation, files such as uvw333 and tfile2 must already be created. If you select continued calculation, the original calculation conditions (upstream pressure, pressure ratio, calculation method) will be displayed, and if there are no problems, press the Enter key to resume the calculation. If there are problems, press the Ctrl key and C at the same time to interrupt. Note that uvw333 and tfile2 are very large files, so be sure to delete them when you no longer need continued calculation.
②If this is your first calculation, the number of threads on your PC will be displayed. Enter a number equal to or less than this number as the number of threads you will actually use. If a value outside the range of 1 to the maximum value is entered, the maximum value will be selected (the maximum value is the recommended one).
③Enter the upstream stagnation point pressure within the range of 1 to 760 mmHg (Torr). If it is less than 1, it will be limited to 1, and if it is larger than 760, it will be limited to 760.
④Enter the pressure ratio (the ratio of the upstream pressure to the downstream back pressure) within the range of 2 to 16. If it is less than 2, it will be limited to 2, and if it is larger than 16, it will be limited to 16.
⑤Select whether to calculate using the Bird method or the U-system (U-sys method). Basically, we would like you to calculate using the U-sys method, but the Bird method is also included for those who only want to calculate using the Bird method (the Bird method is faster in calculation speed, but you cannot expect very good results).
⑥If you select the U-sys method, you can choose from the following six types of U-sys method, as mentioned above. If you are unsure which one to choose, first choose (1) the basic method. Depending on the pressure and pressure ratio conditions, the calculation is not going well. In that case, please select (1) the basic method.
(1) Basic method, (2) Time step 1/2, (3) Time step 1/4,
(4) Prediction using two data, (5) Temporary and actual calculation method,
(6) Method using temporary and actual calculation with a time step of 1/4
The separation time (minimum time step) between molecular motion and intermolecular collision in the DSMC method is fixed at 0.005 μs this time, so if you output one intermediate result in 200 steps, you will get a calculation result every 1 μs, but if 1/2 time step (100 steps) or 1/4 time step (50 steps), it will be 0.5 μs (100 steps) or 0.25 μs (50 steps). In this case, the number of sample molecules will naturally be reduced, so in order to make the statistical fluctuations the same, two or four consecutive outputs can be combined into one (see following OUT09B-62S.exe), so that, calculation results every 1 μs can be obtained.
⑦Once you have selected either the Bird or U-sys method, the upstream pressure, pressure ratio, and calculation method will be displayed for confirmation. If there are no problems, press the Enter key to start the calculation, and after a few seconds, the calculation will begin for each step. If there are errors, press the Ctrl key and C simultaneously to run the calculation again from the beginning. At the same time as the calculation starts, a file called “Setting Condition” indicating the calculation conditions is created, so its contents will be useful as a record later, but the time the file was created is also valuable as the calculation start time.
(C) Calculation execution status
When a calculation is being executed, it is important to pay attention to how far the calculation has progressed at that point (how many μs have passed since the start of the calculation) and whether the result file is being output smoothly. First, pay attention to the following display on the screen.——————————————————-
@@ PTOR= ….. PRAT= …..
——————————————————-
The first number indicates the upstream pressure, the second the pressure ratio, and the third the calculation method. The third number from the end of that line is the number of threads used in the calculation. Each line from the next indicates first which time step, then the time in μs. However, in the case of the provisional/actual calculation method (Usys5 or Usys6), A (provisional calculation) or B (actual calculation) is displayed at the very top. However, the first result output is only A (provisional calculation). Explanations of other screen notations are omitted here. As the calculation progresses, primary result files named AA04c… are created in the same folder in sequence. At the same time, files such as uvw333 and tfile2 for continued calculations are output.
(D) Secondary result files (drawing files) obtained by OUT09B-62S.exe
The created primary result file (AA04c…) can be rewritten by OUT09B-62S.exe into a secondary result file (DOWN+xxx-yyy) that can be used to plot the results, and can be used to investigate how far the supersonic jet has grown. This rewriting work must be done sequentially, separate from the actual DSMC calculations. The time to end one condition of DSMC calculations must be also determined by plotting the jet structure at each moment.
Start OUT09B-62S.exe and first enter whether the plot data is for gnuplot or tecplot. Next, enter the last three digits (or the last two digits) of the first primary result file to be processed (leading zeros are not necessary), then the number of the last primary result file, and the number of results to be averaged (usually 1 will give results every 1 μs. However, if the time step is 1/2, enter 2, and if the time step is 1/4, enter 4 to give results every 1 μs). Of course, it is possible to obtain results at intervals other than 1 μs. If the average number is other than 1 and the total number of data is not divisible by the average number, an error will occur at the end and the process will be interrupted. If this error does not occur, you can automatically delete the primary result file by entering 1 at the very end, but if the process is interrupted due to an error, the primary result file must be deleted manually. Primary result files are quite large, so be sure to delete them when they are no longer needed and do not let them accumulate unnecessarily.
You can also use AVE3-JETS.exe to average secondary result files (drawing files) to create results averaged over a long period of time. For example, suppose 10 pieces of data have been obtained: DOWN-301-304, DOWN-305-308, ….. , DOWN-337-340. Start the software (AVE3-JETS.exe) to average them, and first input whether the data is for gnuplot or tecplot. Next, input the starting number 301, the width of one data piece 4, and the number of data pieces 10, and a long-term average file will be created with the name 1-AVE==301-340.
As explained in Chapter 3, “Velocity profile in a circular tube,” tecplot, which I use exclusively, has a function to connect each of the result figures in succession to create an animation, but gnuplot does not have this function, so to create an animation from gnuplot results, please find free animation creation software available on the Internet and use it. Finally, I will post some of the results I have calculated so far (You may reproduce the examples without permission, but please cite the source ‘DSMC calculation by M.Usami (https://usamimas.net)’, and the same applies to descriptions in other chapters.). Although all of them require a considerable amount of calculation time, they can be calculated using the software released this time, so please give it a try and compare them. Note that I will not show examples of gnuplot plots here, so please refer to Chapters 2 and 3 for gnuplot plots.
(E) Calculation examples
Note: For following results ①~⑧, see the end of the Japanese explanation.
① p=760mmHg, p_ratio=16, U-sys_1
② p=760mmHg, p_ratio=11, U-sys_1
③ p=760mmHg, p_ratio=7, U-sys_1
④ p=760mmHg, p_ratio=4, U-sys_1
⑤ p=760mmHg, p_ratio=4, U-sys_6
⑥ p=760mmHg, p_ratio=2, U-sys_1
⑦ p=760mmHg, p_ratio=2, U-sys_6
⑧ For comparison, still images obtained at the same time (70μs after the start of jet flow) using different methods with an upstream pressure of 760 mmHg and a pressure ratio of 4 are shown. Each has its own characteristics, and it is not possible to say which is better, so please judge for yourself which is better.
(For above results ①~⑧, see the end of the Japanese explanation.)