(The description in English is shown after the Japanese sentence.)
円筒管内の流速分布計算ソフトウェアを提供する前に,いくつかの点を注意しておく必要があります.外乱を発生させる仕組みは,壁面を鋸刃状にし,そこから分子を反射させることです.ただし,実際に内壁を凹凸にするのではなく,表面は平らのままで,分子の反射方向を決めるだけのために軸方向に鋸刃の形状を使用します.便宜上,以降はこれを表面粗さと表現します.前の節で「人為的近似操作」と述べたのはこのことです.これを受け入れがたいという人もいるかもしれませんが,本来,外乱にはそうした不自然さが含まれているものです.鋸刃の凹凸は対称であり,鋸刃の間隔(具体的には一定の長さに対する刃の枚数を入力)と鋸刃の角度をパラメータとして指定します(刃数と角度で1セット).なお,軸方向に異なるパラメータを2セット以上繰り返して設定することも可能ですが,今回のソフトウェアでは1セットのみに限定しています. 鋸刃は対称で刃の数が整数であるため,定常状態では反射分子が壁に及ぼす力はゼロのはずですが,実際には,若干,流れとは逆方向に力が加わっているように見え,流れが壁で少し滑っているように思われます.
壁面から中心軸方向に向かう流れ(y方向の流れ)は,凹面では強く,凸面では弱くなるため,レイリー・テイラー不安定性に類似するものが生じ,壁面付近の流れにゆらぎが生成されて,これが外乱となります.前節の説明では,軸方向の領域長さは,円筒管の直径と同等かそれ以上にすると述べました.しかし,円管の入口と出口には周期的な境界条件を使用しているので,鋸刃数枚分の長さを使えば計算可能です(計算時間は長さにほぼ比例).今回提供するソフトウェアでは,円管の直径とほぼ同じ長さの管路長で計算します(ただし,鋸刃は整数なので大きさの違いが少し出る).計算途中いくつか中間結果を出力した後に定常に達したら,以降,滑らかな平均値が得られるまで計算を続けるので,終了までかなりの時間がかかります.
入力するデータは,① 計算に使用するスレッド数(最大数を推奨),② Re数 (Re数の入力は,1000から7000に制限される.その理由は,1000以下では統計的変動が激しくなるし,7000以上では圧縮性が出てくる可能性が考えられるから),③ 鋸刃数(刃数は小数点付きの実数で指定可能.その場合,刃数自体は整数に四捨五入されるので,管路の長さが調整され,円管直径とは一致しなくなる),④ 鋸刃の角度 (壁表面からの角度),⑤ Bird法か U-sys法かの選択(U-sys法を推奨),⑥ 初期速度分布(一様分布または放物線分布),⑦ 最初から計算するか継続計算するか,⑧ 結果は gnuplot用 か tecplot用か.それぞれ,事前に決めておく必要がある.なお,表面粗さを考慮しない壁面(滑らかな面)で計算することの指定も可能である.初めて計算を行う場合,表面粗さに関してどのような入力データを使用すればよいかを迷うかもしれません.そこで,私が現在推奨している値も使用できるようにします.とりあえずそれを使うという場合は,Re数を入力するだけで,Re=1000~7000の範囲で推奨値(刃数と刃角度)が得られます.これはこれまでの計算結果を整理し,2つのパラメータを単純な関数式で求められるようにしたもので,Re=1000~7000 の範囲に限りますが,その鋸刃枚数と鋸刃角度を使えば,1000<Re<2000 で放物線分布に,3000<Re<7000 で乱流分布に,2000<Re<3000 で遷移状態になるようになっています.Fortranコードで表記した計算式を下記に示します(’**‘ は,べき乗の記号).Reに対して,H が刃数,K が角度(degree) です.
H=(((5000./Re)**3-1.)/15.44+1.)*10.
K=0.111*Re*Re/1000000+1.687*Re/1000+18.26
使い方は簡単ですが,この二つの関数式は単なる数学的補間であり,物理的な意味はありません.一方,今回のシミュレーションが物理的に意味あるものであった場合,それを明らかにするには,今後かなりの調査と検討が必要です.これは私だけの課題ではなく,今これを読んでいる皆さんへの宿題ともなります.
平均流速は Re数に比例して10m/sから70m/sまで変化しますが,計算の基礎となる分子速度は約350m/sであるため,平均流速が低いほど,結果に現れる統計的変動は大きくなります.したがって,滑らかな平均値を求めるために必要なサンプル数,すなわち計算の繰り返し数が多く必要となります. Re数を変更する方法としては,密度や代表長を変更することも考えられますが,その場合,DSMC計算において物理空間を分割するセルの細かさが計算結果にどのような影響を与えるかを詳しく調べる必要があります.そこで今回は平均流速を変えることだけでRe数の調整を行っています.
11個の出力データの並びは,x 座標,y 座標(r座標),数密度 N,u/U(流速u/平均流速U),流速 u,N.u(数密度×流速),温度 T,x方向温度 Tx,yz方向温度 Tyz,v/U (流速v/平均流速U),および 流速 v となります.長さは円管の直径によって無次元化され,速度は平均流速あるいは分子の最大確率速度によって無次元化されていることに注意してください.数密度と温度はそれぞれの初期値で無次元化されます.
●● 計算の実際 ●●
以下に,円筒管内流速分布を求める計算の手順を述べるが,計算の前提として,「2. 試し計算」の項目の内容を熟知し,実際にその計算を体験しているものとして話を進めるので,もしそうでない場合は,先に「2. 試し計算」を実行して,問題なく結果が得られるかどうかを確かめてください.
(A) 計算に必要なファイル
計算に必要な4つのファイルは,①計算ソフトウェア本体(A-OUT6.exe),②65個の乱数列の初期値ファイル(ransuuM65),③定常状態達成後の一連の結果ファイルを加算して平均するためのソフトウェア(DATA6-AVE3.exe),④その他のファイル1つ(libiomp5md.dll).それらは,1つの圧縮ファイル Velocity_Profile (VelocityD) に保存してあるので,「2. 試し計算」のときと同様に,それをダウンロードしたのち,解凍作業を行って4つのファイルに戻します.ダウンロードフォルダ内あるいはデスクトップ上に VelocityD というフォルダができ,その中に4つのファイルが入っているので A-OUT6.exe を実行する.実行しようとした際,もし,Microsoft Defender SmartScreen が「SmartScreenを使用できません」と言ってきても,SmartScreenは賢くないので,気にせず,「実行」してください.なお,計算実行が行われるコマンドプロンプト画面は,そのプロパティのウィンドウ幅を175以上にすると見やすい表示になる.
(B) 計算の開始(キーボードから複数のデータを入力)
①「2. 試し計算」の場合と同様の手順で,計算ソフトウェア本体(A-OUT6.exe)を立ち上げると,使用しているPCのスレッド数が表示されるので,その数値以下の数字を,実際に使用するスレッド数として入力します.1から最大値の数字以外が入力されると,最大値が選択されます(推奨値は最大値です).
②次に,初めての計算の場合は 0 を,継続計算の場合は 1 を入力します.継続計算の場合は,uvw333やtfile2 等のファイルがすでに作られている必要があります.
③Bird法で計算するか,U-system(U-sys法)で計算するかを選択します.基本的には,U-sys法で計算するものであり,Bird法は単に比較をしたい人のために付けてあるに過ぎません.
④Re数(1000~7000)を入力します.
⑤円筒の内壁面を,「滑らかな面」にするか「粗い面」にするかを指定します.滑らかな面を選択した場合は,Re数に関わらず放物線分布の流速が得られます.粗い面を選択すると,鋸刃形状の2つのパラメータについて,自分で決めるか,あるいは推奨値を使うかの選択になります.自分で決める場合は,2つの値の入力になりますが,推奨値を選択した場合には,その値が表示されて次の項目に移ります.
⑥計算を開始するにあたり,流速の初期分布の選択をします.平均流速で一様な分布にするか,放物線分布にするかを選択します.できれば,最終結果とは異なる初期分布を選んだ方が,速度分布が徐々に変化していく様子が観察できます.
⑦結果の出力形式を,gnuplot形式にするか,tecplot形式にするかを選択します.なお,gnuplot用とtecplot用の2つの結果ファイルの違いは,tecplot用では先頭の2行が余計についているだけなので,手作業でそれを削除すれば gnuplot用に変更できる.2つの結果ファイルを見比べて,変更する方法は各自で見つけてください.
以上の入力が全て終わると,計算が開始されます.
(C)計算実行時の様子
計算実行中に注意することは,その時点で計算がどこまで進んでいるかや,結果のファイルが順調に出力されているかということです.まず,画面表示の中で,次の表示部分に注目してください.
——————————————————-
@@ Re = ….. ….. ….. …..
——————————————————-
最初のRe数ですが,必ずしも入力したReの値と完全には一致していないかも知れません.これは,分子の速度を乱数で発生させているので,多少の違いが出てくるものです.2つ目からの数値は,まず,次の説明を理解してください.すなわち,
● DSMC計算の最小時間単位である「分子移動と分子間衝突を分離している時間ステップ」が 200回繰返されると,一つの一次結果ファイル(AA04cxx)が作成される.それが何回か繰返され(繰返す回数は,統計的変動がRe数によって異なるので,Re数が小さいほど大きい),作成された一次結果ファイルが平均されて二次結果ファイル2つ(軸方向に細かく表示される DOWN+xxx-yyyと,軸方向に広く平均された DOWN+xxx-yyy-2)が作成される.なお,計算途中にできた一次結果ファイルは,二次結果ファイルが作成された後,自動的に消去される.●
Re数の次の a/b (=IOUT1/IOUT0) ですが,a は,次に出力される一次結果ファイルが何番目のものか,b は,一次結果ファイルを何回出力したら二次結果ファイルが作成されるか(b は,Re数が小さくなると大きな数値になる)を示すもので,二次結果ファイルが作成されると a は1に戻る.その次の数字は,計算開始から何回目の時間ステップを行っているか,その次は,次回作成される一次結果ファイルは通算で何個目かを示す.そして,入力した鋸刃の数(実数),整数に四捨五入した鋸刃の数,鋸刃を整数化したことによって変化した管路長と管直径との比,そして,鋸刃の角度(degree),Bird法かU-sys法か,初期速度分布と並ぶ.なお,これとほぼ同じ内容が,JB-AKTN2-AKTH というファイルに書き込まれ,一次結果ファイルが作成されるごとに更新される.なお,一次結果ファイルが作成されるたびに作られるuvw333やtfile2等のファイルは,途中から計算を継続するために必要である.もしフォルダ内にそれらが存在していないと継続計算はできない.それ以外の画面表示は,プログラムの開発過程で利用したもので,それぞれ意味はあるが,その説明は省略する.
(D)定常状態に達したかどうかの判断とそれ以降の結果の平均計算
計算が定常状態に達したかどうかの判断は,続いて得られる結果が,統計的変動の範囲内で変化しなくなったかどうかによるので,面倒な数式による判断を避けるのなら,とりあえずは得られた結果の図を目で比較して,経験によって収束判定をしてもらうしかありません.私の経験では,二次結果ファイル DOWN+xxx-yyy および DOWN+xxx-yyy-2 の xxxとyyyが,001から999 まで変化する間には(おそらく500回までには)定常に達すると思います.なお,999の数値のあとは,1000から2000まで変化しますが,数字は3桁しか表示できないので,別の記号で識別できるようになっています.2000回を超えると,最初のファイルと同じ名前になって上書きされてしまいます.なお,gnuplot による結果表示の具体例に関しては後述します.
今,例えば,DOWN-301-315, DOWN-316-330, ….. , DOWN-436-450 の 10データが,定常状態達成後に得られていたとします.それらを平均するためのソフトウェア(DATA6-AVE3.exe)を起動して,まずデータが gnuplot 用か tecplot 用かの判別を入力し,次いで,開始番号の 301,1つのデータ幅の 15,データ数の 10 を順に入力すれば,DOWN+xxx-yyy の平均が 1-AVE==301-450 という名前のファイルで,DOWN+xxx-yyy-2 の平均が 2-AVE==301-450 の名前で作成されます.これにより統計的変動を少なくした結果が得られます.
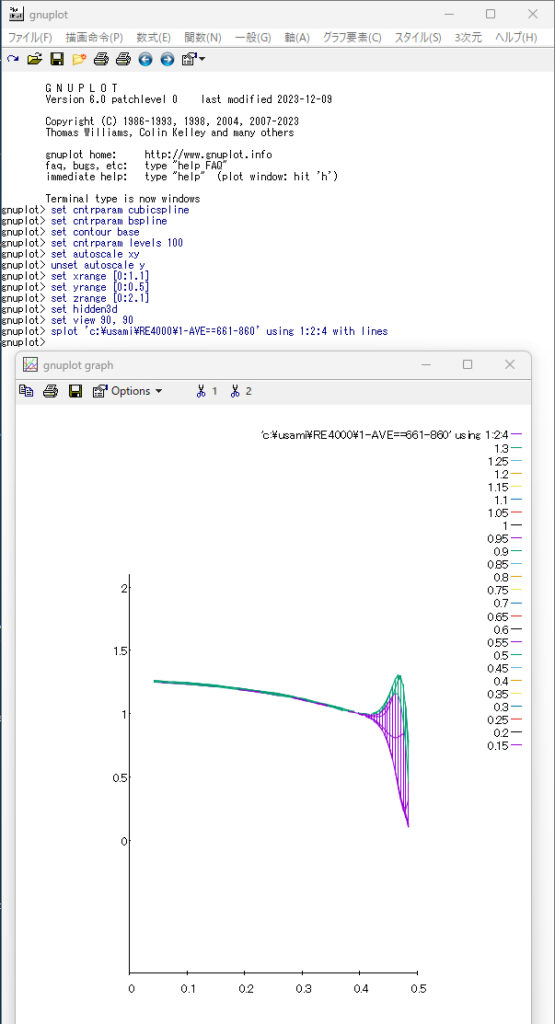
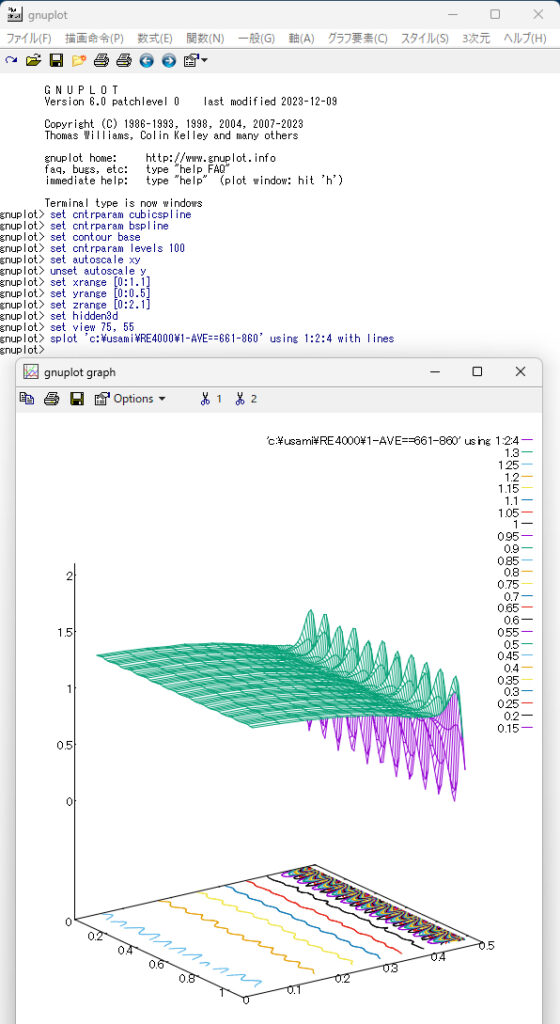
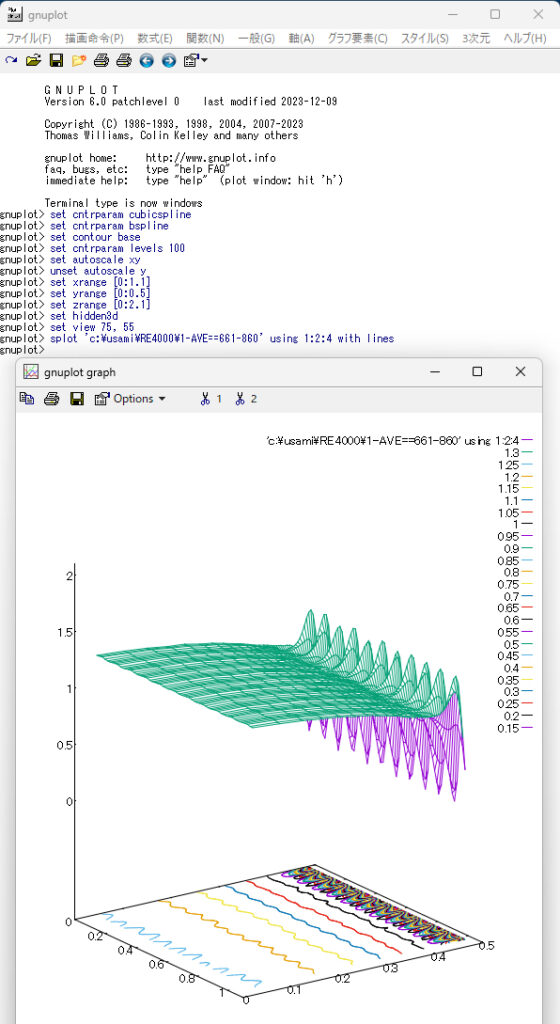
結果表示にtecplotを使う場合では,結果の図の一枚一枚を連続でつなぎ合わせてアニメーションを作成する機能が備わっているが,私の知る限り,gnuplotにはその機能はない.したがって,gnuplotでアニメーションを作成するには,ネットで公開されているアニメーション作成用の無料ソフトを探してそれを利用してください.最後に,gnuplot による結果表示を二例(図の下に作画命令を表示)示しておきますので,それを参考に,gnuplotで結果の作画を行ってください.なお,set view 90, 90 あるいは set view 75, 55 は,図を見る角度を調整する命令です.

set cntrparam cubicspline
set cntrparam bspline
set contour base
set cntrparam levels 100
set autoscale xy
unset autoscale y
set xrange [0:1.1]
set yrange [0:0.5]
set zrange [0:2.1]
set hidden3d
set view 90, 90
splot ‘c:\usami\RE4000\1-AVE==661-860’ using 1:2:4 with lines
——————————————————————————-

set cntrparam cubicspline
set cntrparam bspline
set contour base
set cntrparam levels 100
set autoscale xy
unset autoscale y
set xrange [0:1.1]
set yrange [0:0.5]
set zrange [0:2.1]
set hidden3d
set view 75, 55
splot ‘c:\usami\RE4000\1-AVE==661-860’ using 1:2:4 with lines
——————————————————————————-
今回のソフトウェアについては,公開するのは初めての試みなので,不備な部分もあるかも知れません.これに関して,疑問点をお聞かせいただくための「問い合わせ欄」を設けましたのでご利用ください.
Before providing calculation software for flow velocity distribution in a cylindrical tube, it is important to note several points.
The mechanism for generating the disturbance is to make the wall surface into a saw blade shape and reflect the molecules from it. However, rather than actually making the inner wall uneven, the surface remains flat, and a saw blade shape is apparently used in the axial direction, only to determine the direction in which molecules are reflected. For convenience, this will be expressed as surface roughness from now on. This is what I was referring to when I said “artificial approximation” earlier. Some people may find this difficult to accept, but disturbances originally include such unnaturalness. The unevenness of the saw blade is symmetrical, and the spacing between the saw blades (specifically, the number of blades for a certain length is input) and the angle of the saw blade are specified as a set of parameters. Note that the repeating two or more sets of different parameters can be set along axial direction, but the software in this time is limited to only one set. Since the saw blade is symmetrical and the number of blades is an integer, the force exerted on the wall by the reflective molecules should be zero in a steady state, but in reality, it seems that the force is applied slightly in the opposite direction to the flow, and the flow appears to be slipping a little on the wall.
The flow from the wall toward the center axis (flow in y direction) is stronger on concave surfaces and weaker on convex surfaces, so something similar to Rayleigh-Taylor instability occurs, causing fluctuations in the flow near the wall surface, which becomes a disturbance. In the previous description, it was stated that the axial region length should be greater than or equal to the cylinder diameter. But since periodic boundary conditions are used at the entrance and exit of the circular tube, calculations can be made if you use the length of a few saw blades (the calculation time is approximately proportional to the length). The software provided this time calculates a tube length that is approximately the same length as the diameter of the circular tube (there are some differences in size because the saw blade is an integer). Once a steady state is reached after outputting some intermediate results during the calculation, the calculation continues until a smooth average value is obtained, so it takes a considerable amount of time to complete.
The data to be input is ①the number of threads to use (maximum number is recommended), ②Re number (Input for Re number is limited to 1000 to 7000, because statistical fluctuations become severe when less than 1000, and there is a possibility that compressibility may appeare when more than 7000), ③the number of saw blades (the number of blades can be specified as a real number with a decimal point, in which case the number of blades itself will be rounded off to an integer and then tube length does not necessary match the tube diameter), ④the blade angle (angle from wall surface), ⑤Bird method or U-sys method (U-sys method is recommended), ⑥initial velocity distribution (uniform distribution or parabolic distribution), ⑦calculation from the beginning or continuous calculation, and ⑧whether to output the results for gnuplot or tecplot. You need to decide in advance what you will use. Note that calculations can also be performed without considering surface roughness (smooth surface). If you are doing calculations for the first time, you may be confused about what input data to use regarding surface roughness. So I also propose the values that I currently recommend. If you want to use it for the time being, just input the Re number and you can obtain the recommended value (number of blades and blade angle) in the range of Re = 1000 to 7000. The value introduced by the past experience data for the number of blades and for blade angle in the range of 1000 to 7000 is calculated with a simple function so that 1000<Re<2000 gives a parabolic distribution, 3000<Re<7000 gives a turbulent distribution and 2000<Re<3000 gives transition state. The two calculation formulas written in Fortran code are shown below (‘**‘ is the exponent symbol). For Re, H is the number of blades and K is the angle (degree).
H=(((5000./Re)**3-1.)/15.44+1.)*10.
K=0.111*Re*Re/1000000+1.687*Re/1000+18.26
Although it is easy to use, these two functions are simply mathematical interpolations and have no physical meaning. On the other hand, if the present simulation does have any physical meaning, it will require considerable further investigation and study to clarify this. This is not only my assignment, but also a homework assignment for everyone reading this right now. The average flow velocity changes from 10 m/s to 70 m/s in proportion to the Re number, but since the molecular velocity that is the basis of the calculation is about 350 m/s, the lower the average flow velocity, the more severe the fluctuating components that appear in the results will be. Therefore, the number of samples required to obtain a smooth average value, that is, the number of repetitions of calculation, is required. Possible ways to change the Re number also include changing the density and representative length, but in that case, it is necessary to investigate in detail how the fineness of cells that divide the physical space in DSMC calculations affects the calculation results. Therefore, this time, we will adjust the Re number only by changing the average flow velocity.
The output data sequence (11 data) is x coordinate, y coordinate (r coordinate), number density N, u/U (flow_velocity/average_flow_velocity), flow velocity u, N.u (number_density times flow_velocity), temperature T, x direction temperature Tx, yz direction temperature Tyz, v/U (flow_velocity_v/average_flow_velocity), and flow velocity v. Note that length is normarized by the tube diameter, velocity is normarized by the average flow velocity or by the most probable molecular thermal speed. Number density and temperature are normarized by their initial values respectively.
●● Actual calculation ●●
Below, we will describe the calculation procedure for determining the flow velocity distribution in a cylindrical tube. As a prerequisite for the calculation, we will proceed with the discussion assuming that you are familiar with the contents of “2. Test Calculation” and have actually experienced the calculation. If this is not the case, please run “2. Test Calculation” first and check whether the results are obtained without any problems.
(A) Files required for calculation
The four files required for calculation are: ① Calculation software main body (A-OUT6.exe), ② Initial value file of 65 random number sequences (ransuuM65), ③ Software for averaging a series of result files after steady state is achieved (DATA6-AVE3.exe), and ④One other file (libiomp5md.dll). They are saved in one compressed file ‘Velocity_Profile (VelocityD)’, so just like in “2. Test Calculation” download it and unzip it back into four files. A folder called VelocityD will be created in the download folder or on the desktop, and there will be four files in it, so run A-OUT6.exe. When you try to run it, if Microsoft Defender SmartScreen says “SmartScreen cannot be used,” don’t worry about it and just “Run” because SmartScreen is not smart. The command prompt screen where calculations are executed will be displayed more easily if you set the window width of the property to 175 or more.
(B) Start calculation (enter multiple data from keyboard)
① Follow the same procedure as in “2. Test Calculation” to start the calculation software (A-OUT6.exe). The number of threads on the PC you are using will be displayed, so enter a number less than or equal to that number as the number of threads actually used. If a number other than 1 to the maximum value is entered, the maximum value will be selected (the recommended value is the maximum value).
②Next, enter 0 for the first calculation, or 1 for continuous calculation. For continuous calculation, files such as uvw333 and tfile2 must already be created.
③Select whether to calculate using Bird method or U-system (U-sys method). Basically, it must be calculated using the U-sys method, and the Bird method is simply included for those who want to make comparisons.
④Enter Re number (1000 to 7000).
⑤ Specify whether the inner wall surface of the cylinder should be a “smooth surface” or a “rough surface.” If a smooth surface is selected, a parabolic distribution of flow velocity will be obtained regardless of the Re number. If you select the rough surface, you will have the choice of determining the two parameters of the saw blade shape yourself or using the recommended values. If you decide on your own, you will need to enter two values, but if you select the recommended value, that value will be displayed and you will move on to the next item.
⑥ Before starting the calculation, select the initial distribution of flow velocity. Select whether to use a uniform distribution with the average flow velocity or a parabolic distribution. If possible, it is better to choose an initial distribution that is different from the final result so that you can observe how the velocity distribution gradually changes.
⑦Select whether to output the results in gnuplot format or tecplot format. The difference between the two result files for gnuplot and tecplot is that the tecplot file has two extra lines at the beginning, so you can change it to the gnuplot file by manually deleting them. Compare the two result files and find out how to make changes on your own.
Once all the above inputs are completed, calculation will start.
(C) State during calculation execution
What you need to be careful about while running a calculation is how far the calculation has progressed at that point, and whether the result file is being output smoothly. First, please pay attention to the following part of the screen display.
——————————————————-
@@ Re = ….. ….. ….. …..
——————————————————-
The first number is Re number, but it may not necessarily match the input Re value completely. This is because the velocity of the molecules is generated using random numbers, so there will be some differences. For the second and subsequent numbers, first understand the following explanation. That mean,
●When the “time step separating molecular motion and intermolecular collision”, which is the minimum time unit of DSMC calculation, is repeated 200 times, one primary result file (AA04cxx) is created. This is repeated many times (the smaller the Re number, the greater the number of repetitions, since the statistical variation depends on the Re number), and the created primary result files are averaged to make two secondary result files. The formar “DOWN+xxx-yyy” is displayed in detail in the axial direction and the latter “DOWN+xxx-yyy-2” is widely averaged. Note that the primary result files created during calculation will be automatically deleted after the secondary result file is made.●
Next to the Re number is a/b (=IOUT1/IOUT0), where “a” indicates the number of the primary result file to be output next. “b” indicates how many times the primary result file must be output to create the secondary result file. When the secondary result file is created, “a” returns to 1. “b” becomes a large number as the Re number becomes small. The next number shows how many time steps have been performed since the start of the calculation, and the next number shows how many primary result files will be created next time. Then, the number of saw blades input (real number), the number of saw blades rounded to an integer, the ratio of tube length to tube diameter changed by converting the saw blades into integers, and the angle of the saw blade (degree), Bird method or U-sys method, along with the initial velocity distribution. Note that almost the same content as this is written to a file called JB-AKTN2-AKTH, and is updated every time the primary result file is created. Note that files such as uvw333 and tfile2, which are created each time a primary result file is created, are necessary to continue the calculation from the middle. If they do not exist in the folder, continuous calculation will not be possible. The other screen displays were used during the program development process, and each has a meaning, but their explanation will be omitted.
(D) Determining whether steady state has been reached and calculating the average of subsequent results
Judging whether the calculation has reached a steady state depends on whether the results obtained subsequently no longer change within the range of statistical fluctuations. So if you want to avoid making judgments based on complicated mathematical formulas, for now, you have no choice but to see it with your own eyes. The only way to do this is to visually compare the resulting diagrams and judge convergence based on experience. In my experience, I think that xxx and yyy in the secondary result files DOWN+xxx-yyy and DOWN+xxx-yyy-2 reach a steady state while varying from 001 to 999 (probably by the 500th time). Note that, after the number 999, the numbers change from 1000 to 2000, but since only 3 digits can be displayed, different symbols can be used to identify them. If it exceeds 2000 times, it will be overwritten with the same name as the first file. A specific example of displaying results using gnuplot will be described later.
Now, for example, suppose that 10 data of DOWN-301-315, DOWN-316-330, ….., DOWN-436-450 were obtained after steady state was achieved. Start the software (DATA6-AVE3.exe) to average them, first input whether the data is for gnuplot or tecplot, then input the starting number 301, the width of one data 15, and the number of data 10. If you will input above data in order, the average for data ‘DOWN+xxx-yyy’ will be created with the name ‘1-AVE==301-450’, and the average for data ‘DOWN+xxx-yyy-2’ will be created with the name ‘2-AVE==301-450’. This allows you to obtain results with less statistical variation.
When using tecplot to display results, it has a function to create an animation by sequentially stitching the resulting figures one by one, but as far as I know, gnuplot does not have that function. Therefore, to create animations with gnuplot, find free animation creation software available on the internet and use it. Finally, I will show two examples of displaying results using gnuplot (plot instructions are displayed below the figure), so please refer to them when plotting the results using gnuplot. Furthermore, ‘set view 90, 90’ or ‘set view 75, 55’ is a command to adjust the viewing angle of the figure.

set cntrparam cubicspline
set cntrparam bspline
set contour base
set cntrparam levels 100
set autoscale xy
unset autoscale y
set xrange [0:1.1]
set yrange [0:0.5]
set zrange [0:2.1]
set hidden3d
set view 90, 90
splot ‘c:\usami\RE4000\1-AVE==661-860’ using 1:2:4 with lines
——————————————————————————–

set cntrparam cubicspline
set cntrparam bspline
set contour base
set cntrparam levels 100
set autoscale xy
unset autoscale y
set xrange [0:1.1]
set yrange [0:0.5]
set zrange [0:2.1]
set hidden3d
set view 75, 55
splot ‘c:\usami\RE4000\1-AVE==661-860’ using 1:2:4 with lines
——————————————————————————–
As this is the first time we are releasing this software to the public, I think there may be any flaws. We have set up an “Inquiry column” for you to ask any questions you may have regarding this, so please use it.